Introduction
In the ever-evolving landscape of web applications, ensuring optimal performance and reliability is paramount. Monitoring tools like Prometheus, coupled with exporters and visualization tools like Grafana, empower us to keep a close eye on our web services. In this blog post, we’ll explore the setup and configuration of Prometheus and Grafana to monitor a website using the Blackbox Exporter.
Setting the Stage
Before we dive into the technical details, let’s set the stage. We have a high-traffic website that we want to monitor for various metrics related to its performance. To achieve this, we’ll use Prometheus as our monitoring tool, the Blackbox Exporter to probe our website, and Grafana for visualizing the collected data.
Prometheus Configuration
The Prometheus configuration file (prometheus.yml) includes two jobs: one for Prometheus itself and another for the Blackbox Exporter. The latter is configured to scrape our target website on port 9115.
# … (global config and other sections)
scrape_configs:
– job_name: “prometheus”
static_configs:
– targets: [“localhost:9090”]
– job_name: ‘blackbox’
metrics_path: /probe
params:
module: [http_2xx]
static_configs:
– targets:
– https://website.com
relabel_configs:
– source_labels: [__address__]
target_label: __param_target
– source_labels: [__param_target]
target_label: instance
– target_label: __address__
replacement: localhost:9115
– job_name: ‘blackbox_exporter’
static_configs:
– targets: [“localhost:9115”]
Creating a Grafana Dashboard
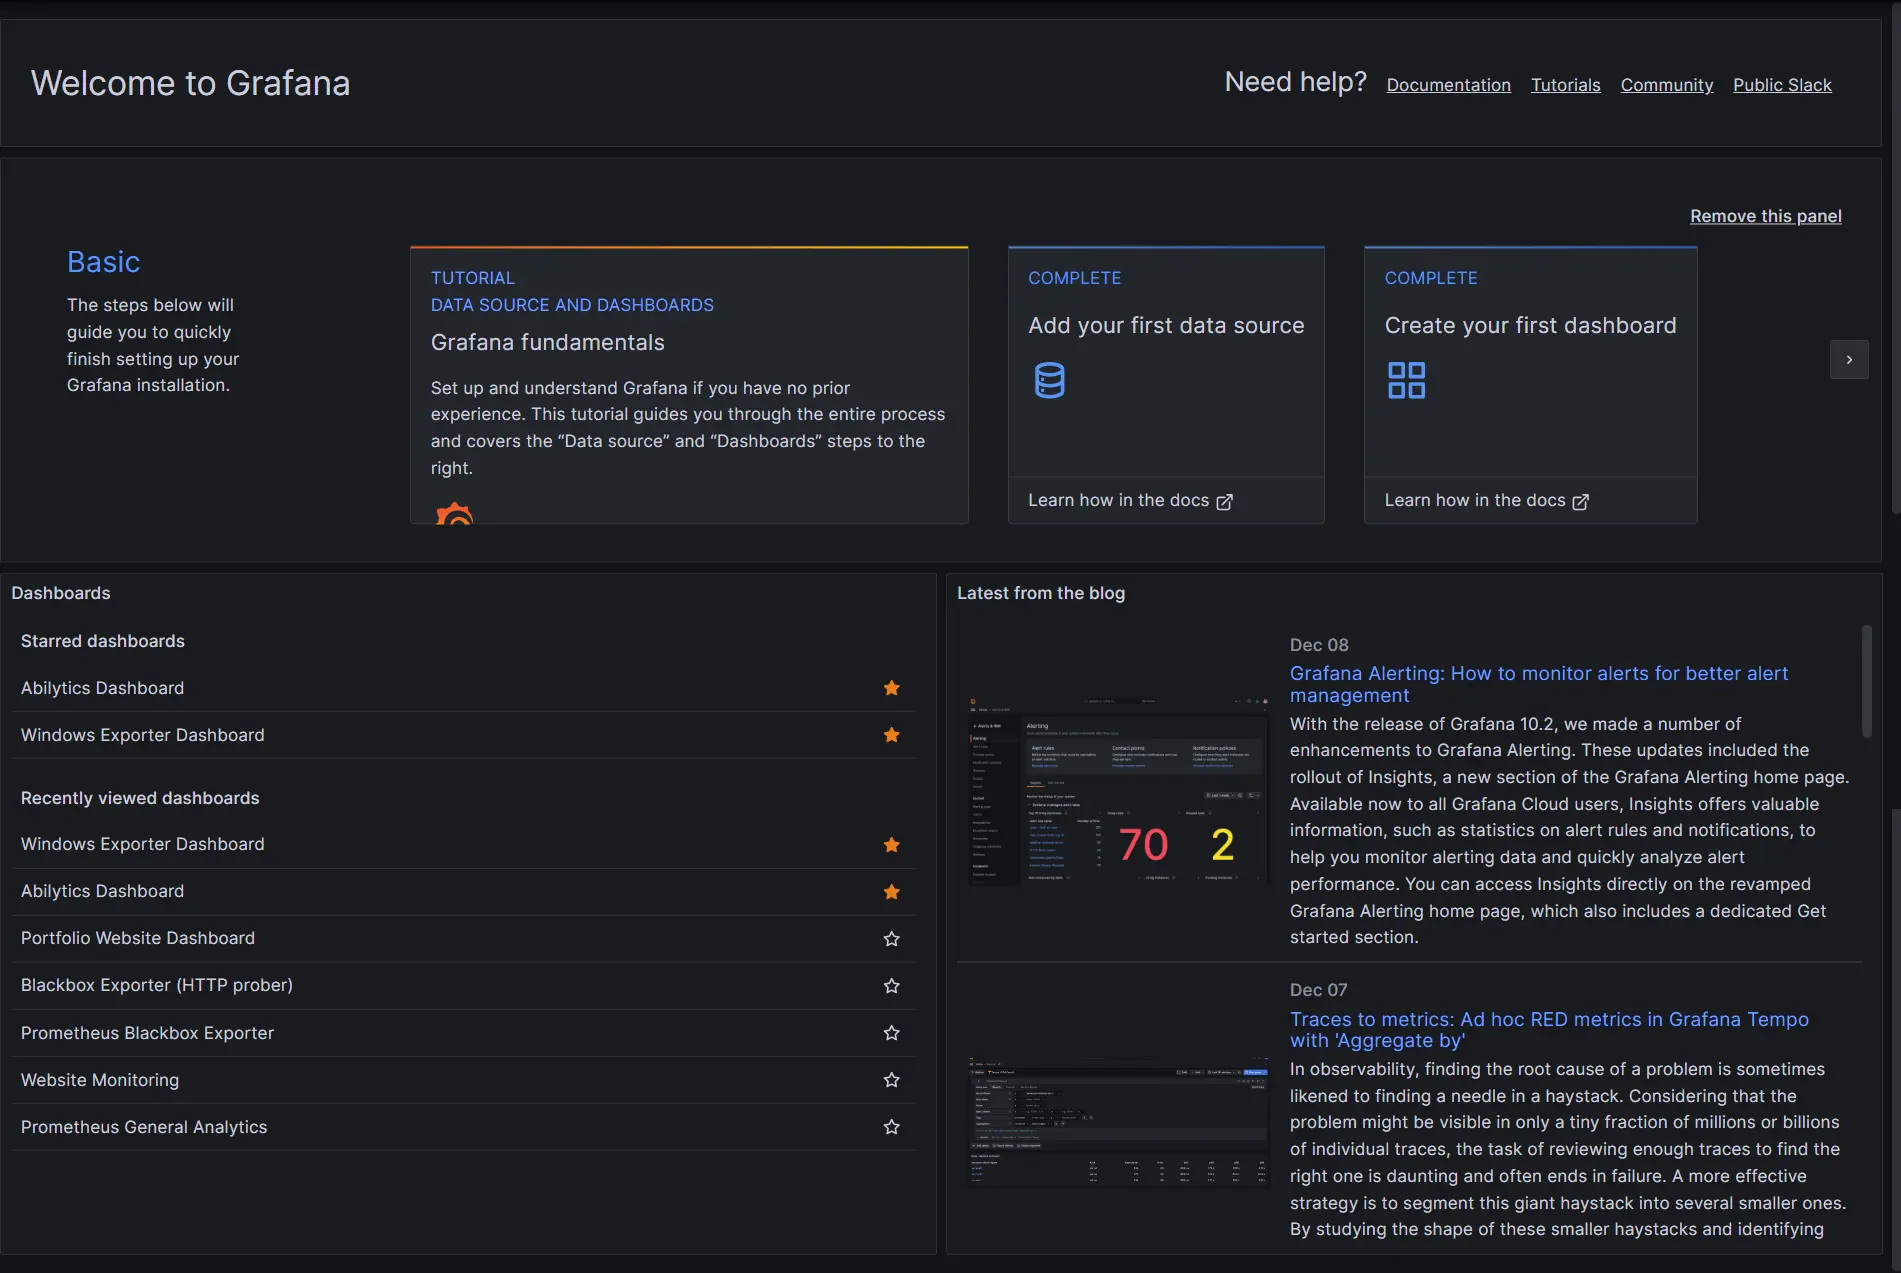
First, ensure that Grafana is installed and running. You can access the Grafana dashboard by navigating to http://localhost:3000 in your web browser.
Adding Prometheus as a Data Source
To begin integrating Prometheus with Grafana, navigate to the “Connections” menu located in the left sidebar. Within the “Connections” menu, select the “Data Sources” option. This will present you with a list of available data sources. From this list, choose Prometheus.
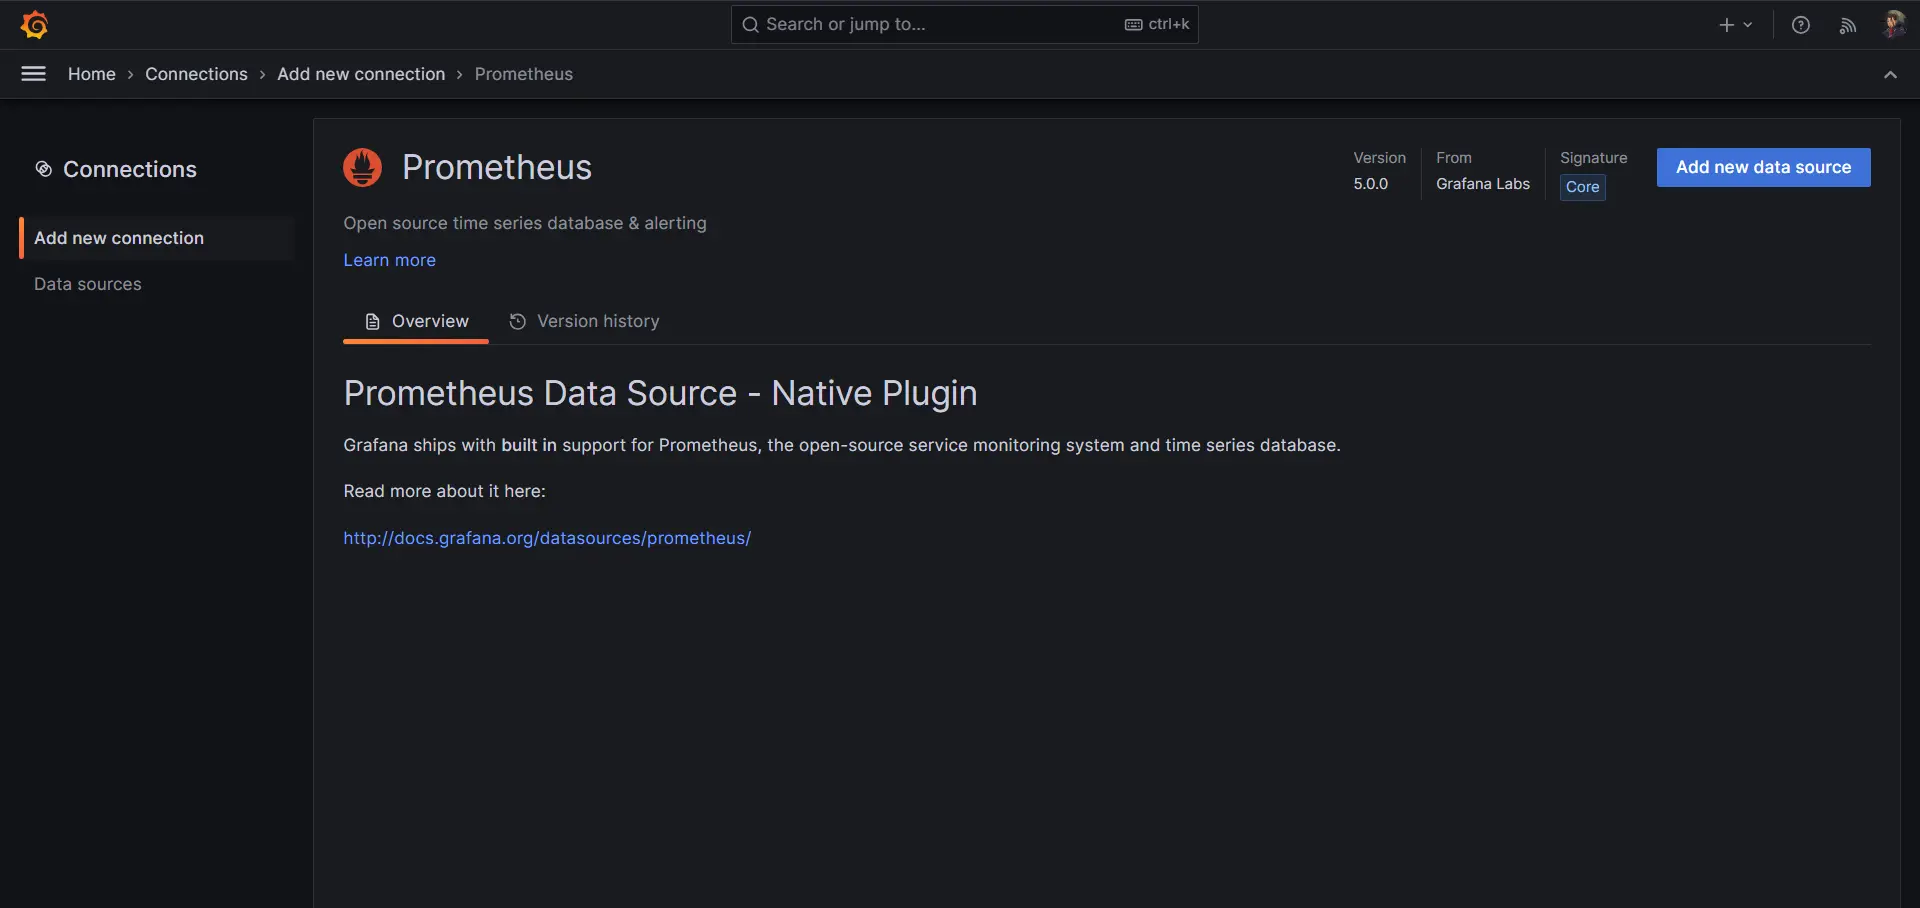
Upon selecting Prometheus, you will be presented with a section labeled “HTTP.” In this section, enter the URL of your Prometheus server. The default URL is http://localhost:9090, assuming Prometheus is running on the same machine as Grafana. However, if your Prometheus server resides on a different machine, you will need to provide the appropriate URL (if localhost doesn’t work, use IPv4 instead like “http://IPv4:9090”)
Creating a New Dashboard
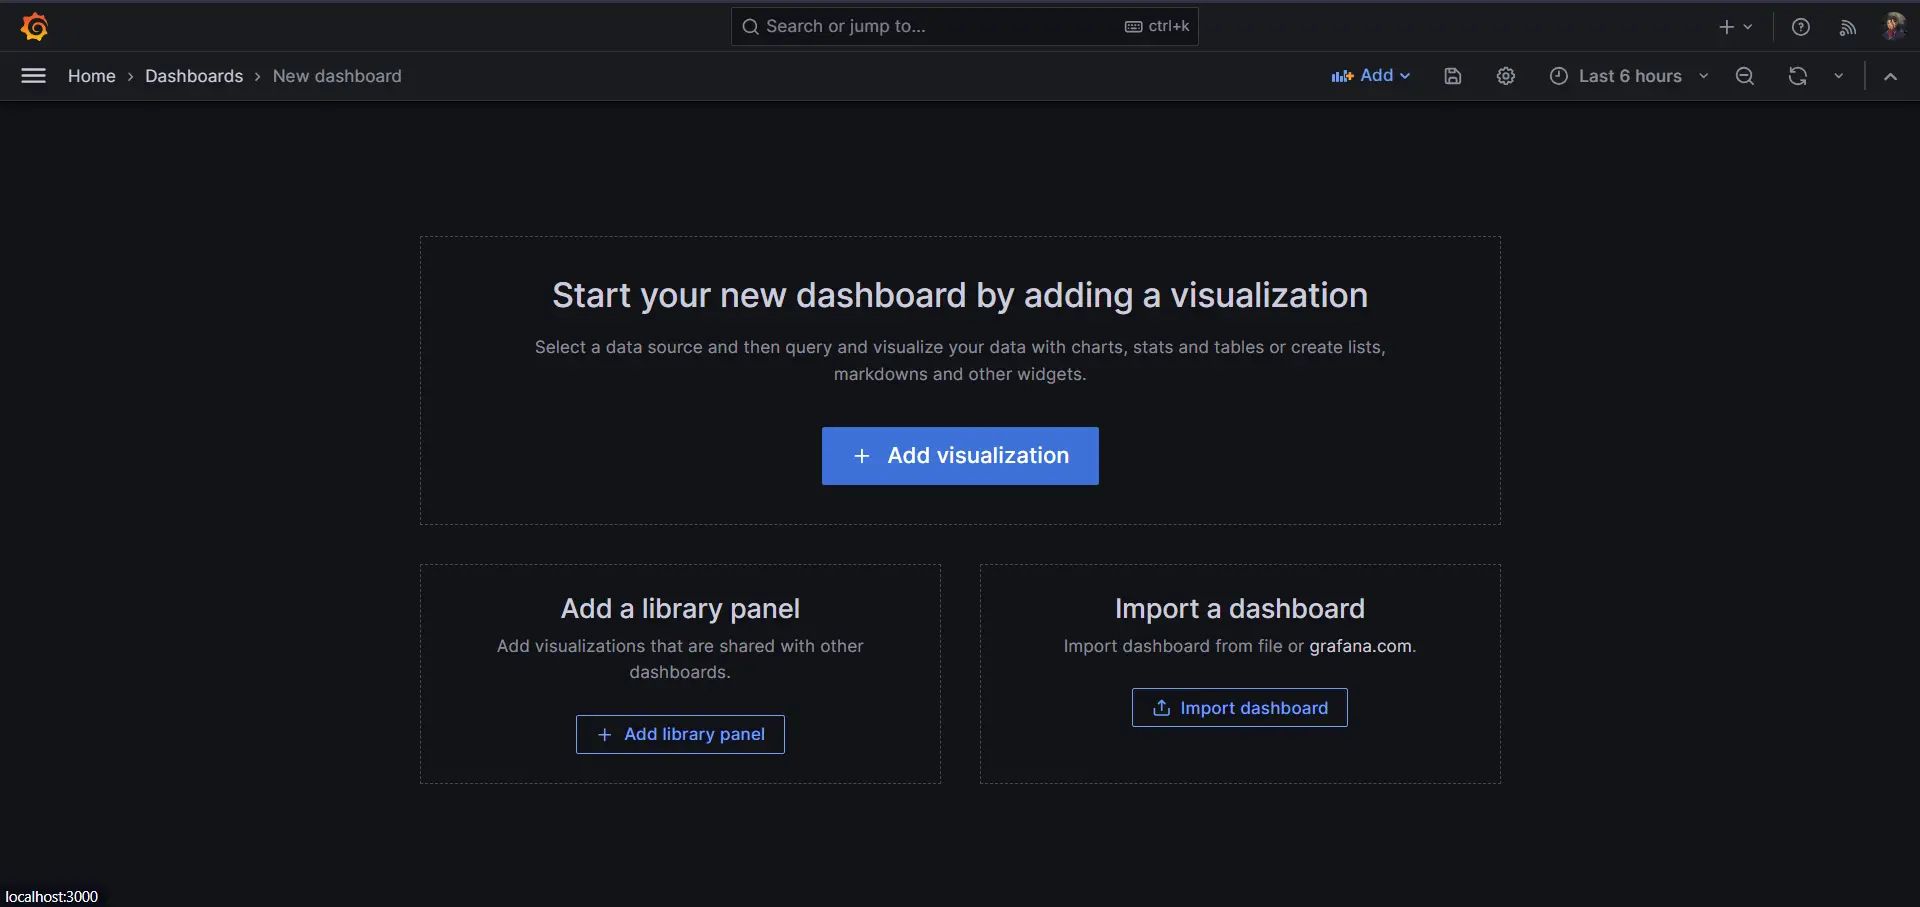
Once you have successfully added Prometheus as a data source, you can start creating dashboards to visualize your metrics. To do so, locate the “+” icon in the left sidebar and click on it to reveal the “Create” menu. From the “Create” menu, select “Dashboard” to initiate the dashboard creation process.
Adding Panels
After creating a new dashboard, you can start adding panels to display the metrics you want to monitor. To add a panel, simply click on the “Add Panel” button. For each panel, you will need to configure the metric query using PromQL (Prometheus Query Language). PromQL provides a powerful way to filter and aggregate metrics from your Prometheus server.
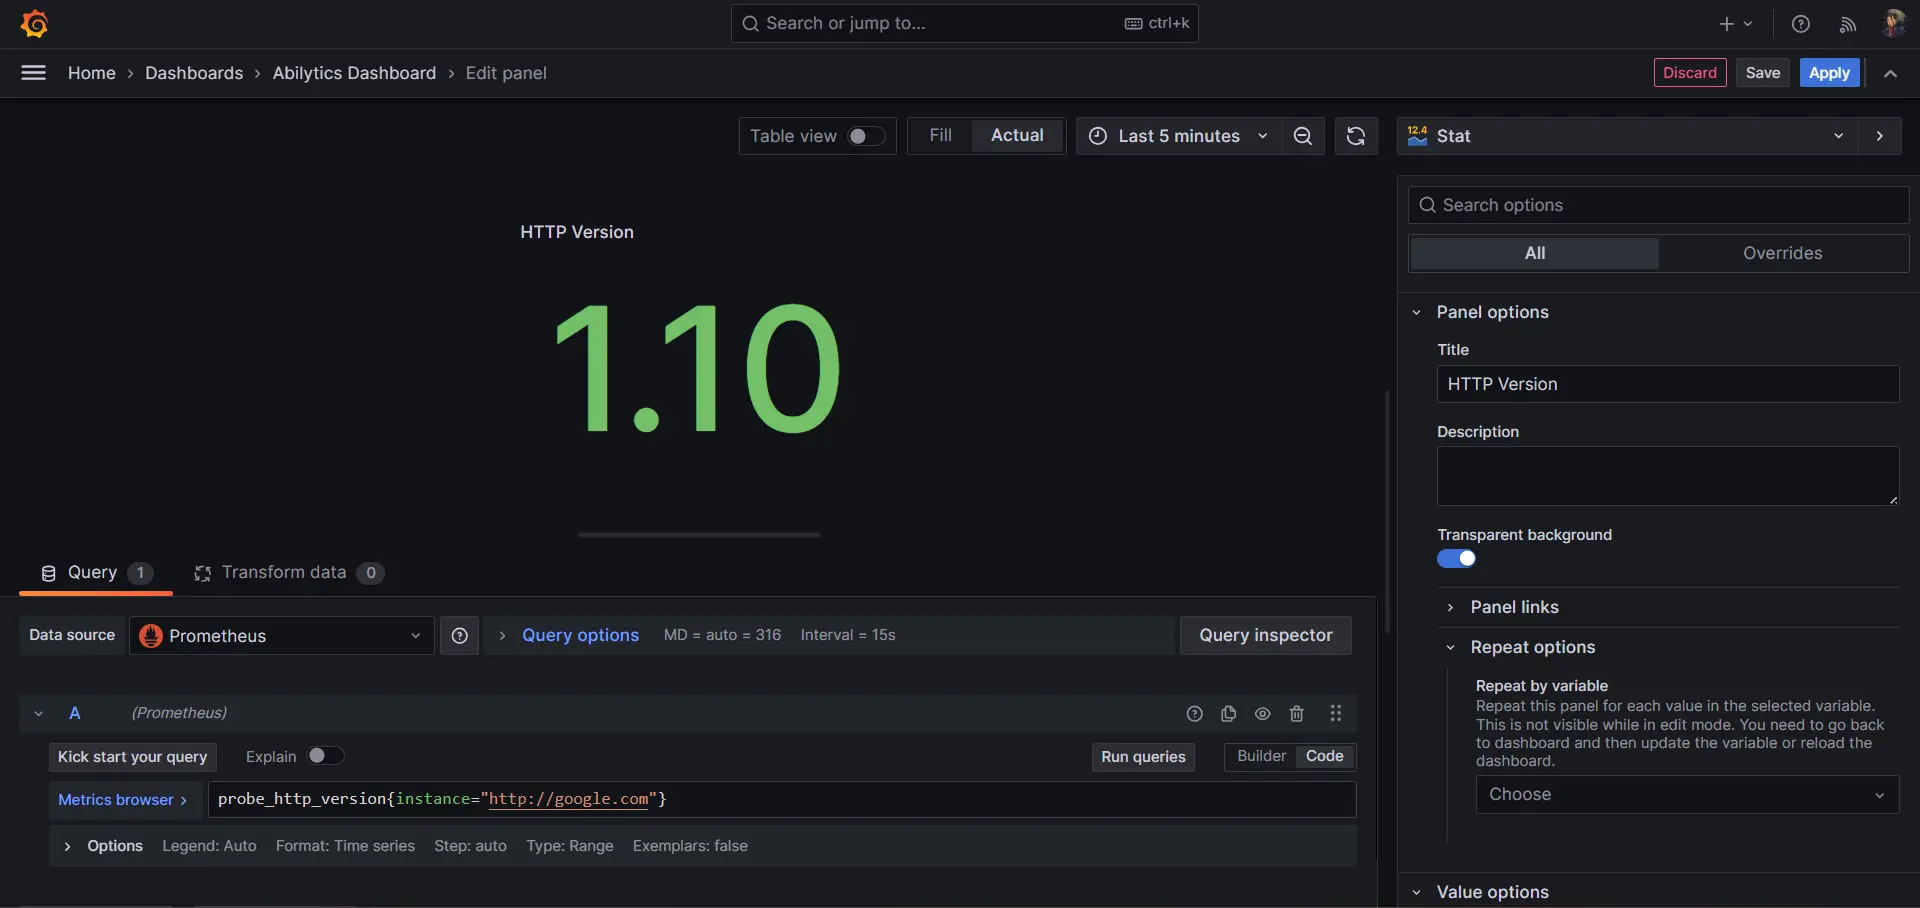
Adjust additional settings for each panel, such as visualization type (bar chart, time series, stats chart, etc.), legend format, and axis labels according to your preference.
Here are some of the metrics used for building the dashboard:
- probe_http_version{instance=”https:// website.com”}
- avg(probe_duration_seconds{instance=”https:// website.com”}) by (instance)
- avg(probe_dns_lookup_time_seconds{instance=”https:// website.com”}) by (instance)
- probe_http_status_code{instance=”https:// website.com”}
- probe_ssl_earliest_cert_expiry{instance=”https:// website.com”} – time()
- probe_ip_protocol{instance=”https:// website.com”}
- probe_http_duration_seconds{instance=”https:// website .com”}
- probe_failed_due_to_regex{instance=”https://website.com”}
Tailoring Your Dashboard for Optimal Viewing
Once you have added panels to your dashboard, it’s time to craft an aesthetically pleasing layout. Grafana’s intuitive drag-and-drop interface allows you to arrange and resize panels to suit your preferences. Experiment with different arrangements to find a layout that effectively conveys your metrics and enhances visual clarity. To further customize your dashboard, click on the gear icon located at the top of the dashboard.
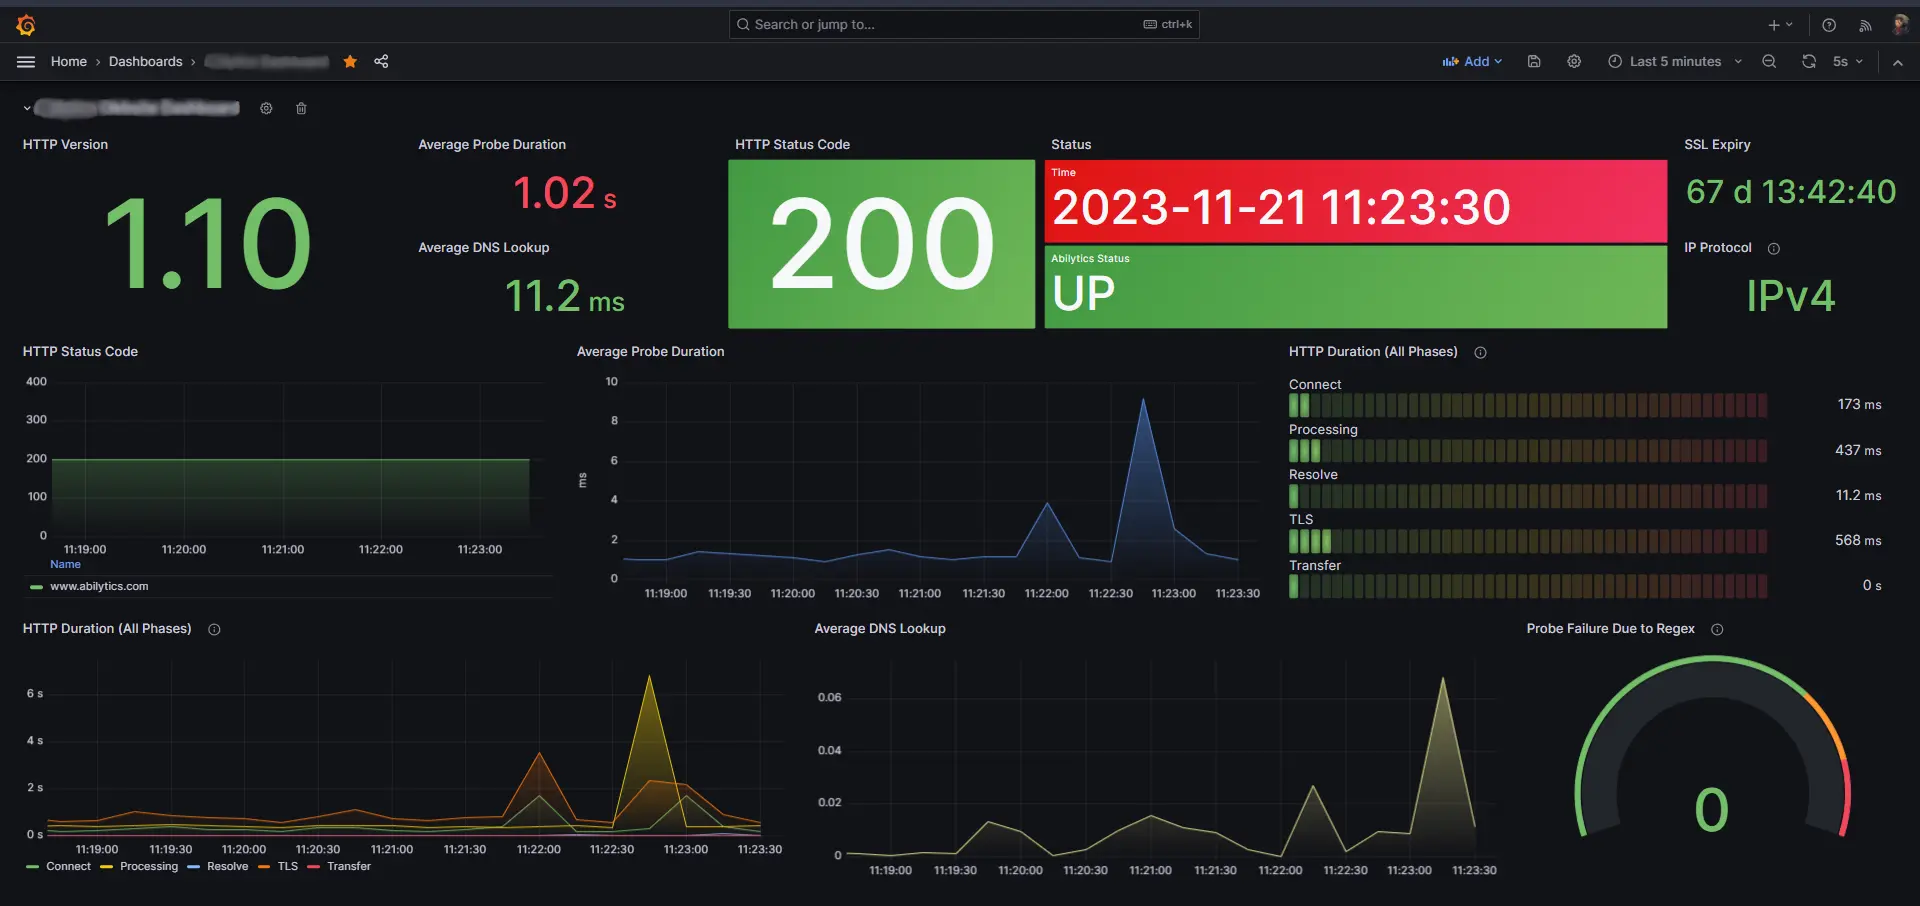
This will reveal a panel of settings where you can modify the dashboard’s overall appearance. Adjust the title to accurately reflect the metrics being displayed. Additionally, you can customize the time range to focus on a specific period of time or set it to auto-update to display real-time data.
Saving the Dashboard
After meticulously crafting your dashboard, don’t forget to save it for future reference. Click on the disk icon in the top menu, provide a descriptive name for your dashboard, and click “Save.” This will ensure that your personalized dashboard layout and settings are preserved for future access.
Alerts
Alert Rules
To add alert rules in Grafana, follow these steps:
Begin by navigating to the Alerts and Rules section within Grafana.Hover your cursor over the Grafana Cloud Alerting icon and then click on “Alerts and rules.” If you have multiple Prometheus or Loki data sources, a dropdown menu will appear at the top. Choose the desired data source for which you want to create or modify rules. Click the “Edit Rules” button to access the alert rule management interface. To create a new alert rule, click the “Add Rule” button.
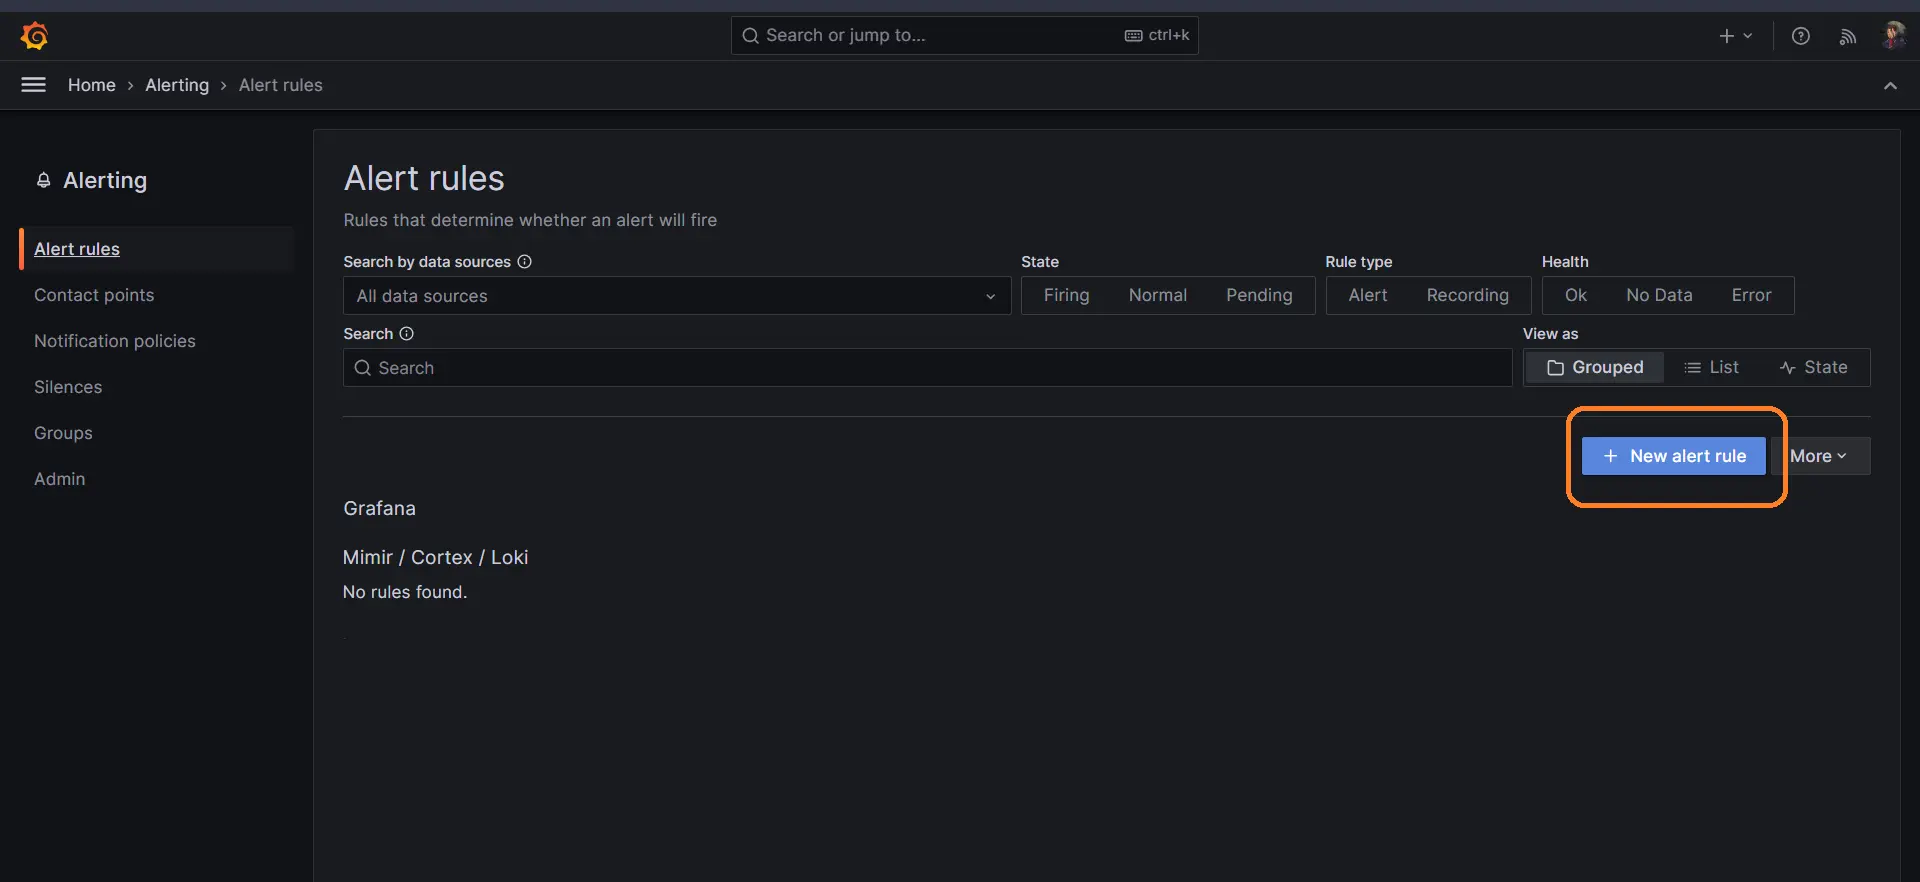
Now, provide the necessary information for the alert rule:
- Rule Name: Enter a descriptive name for the alert rule to easily identify its purpose.
- Query: Specify the Prometheus Query Language (PromQL) query that evaluates the condition for the alert. This query defines the metric or metrics you want to monitor.
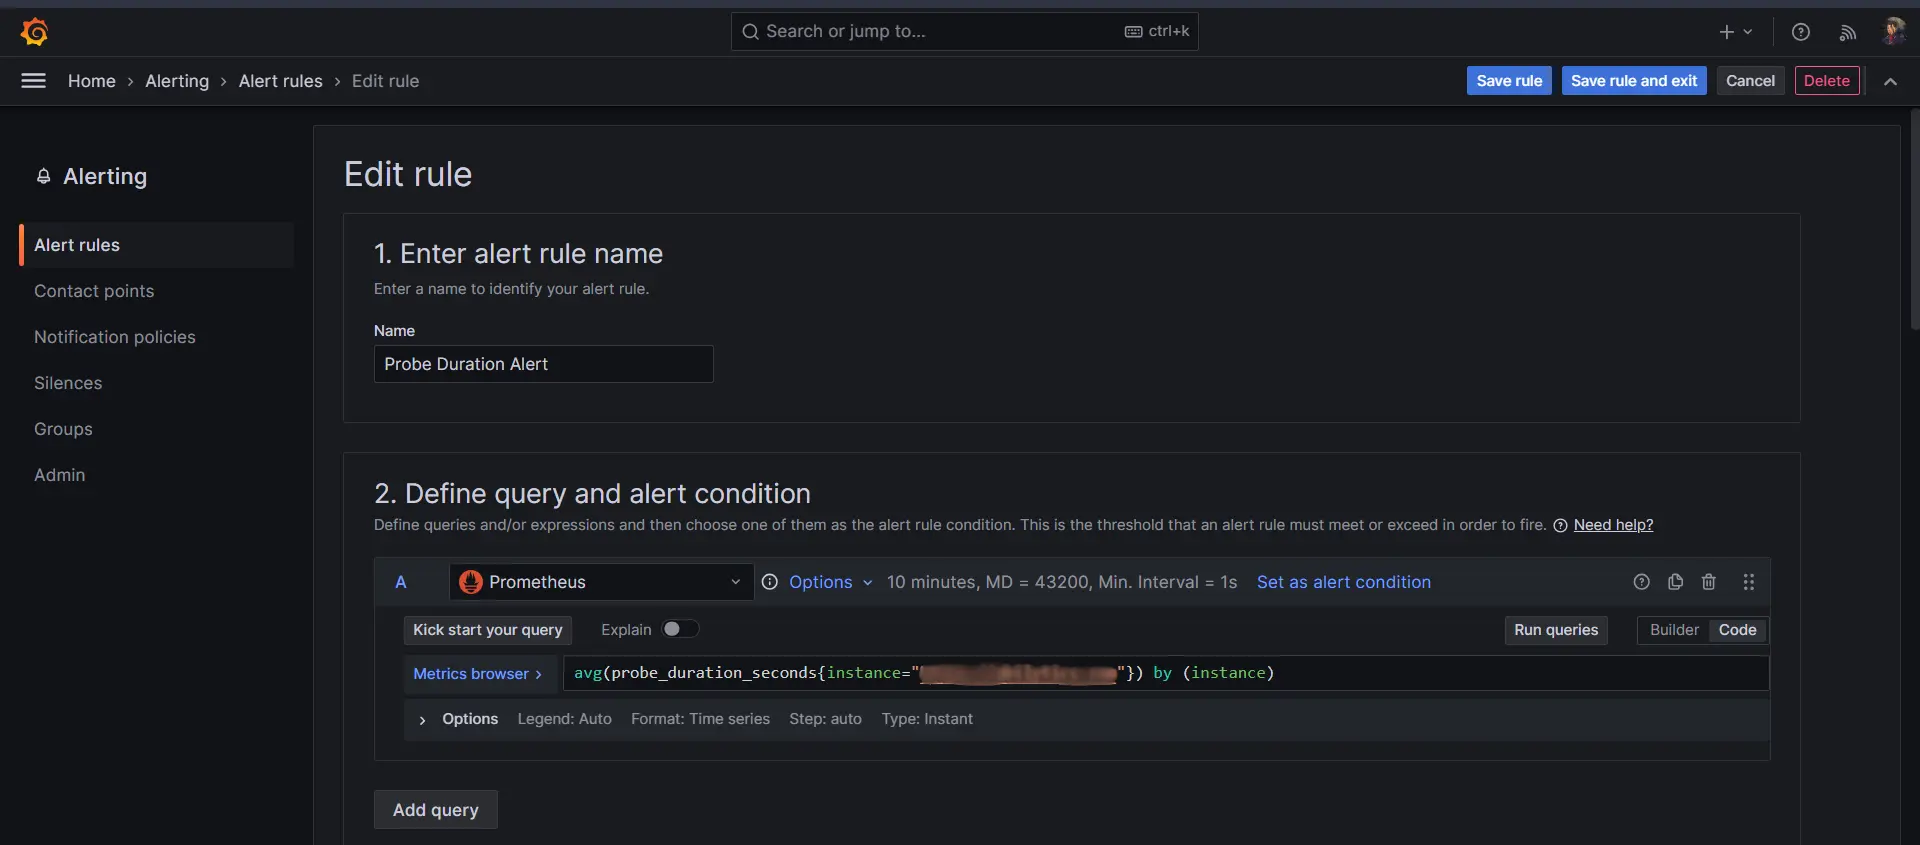
- Condition: Define the condition that must be met for the alert rule to trigger. For example, you could set a condition like avg(cpu_usage) > 0.9 to trigger when the average CPU usage exceeds 90%. ( I have used “avg(probe_duration_seconds{instance=”https://website.com”}) by (instance)” for the purpose of monitoring this website’s performance)
- Annotations: (Optional) Add annotations to provide additional context or explanations about the alert rule. Annotations can be helpful for documenting the purpose or actions to be taken when the alert triggers.
- Labels: (Optional) Assign labels to the alert rule for categorization and grouping purposes. Labels help organize and manage multiple alert rules effectively.
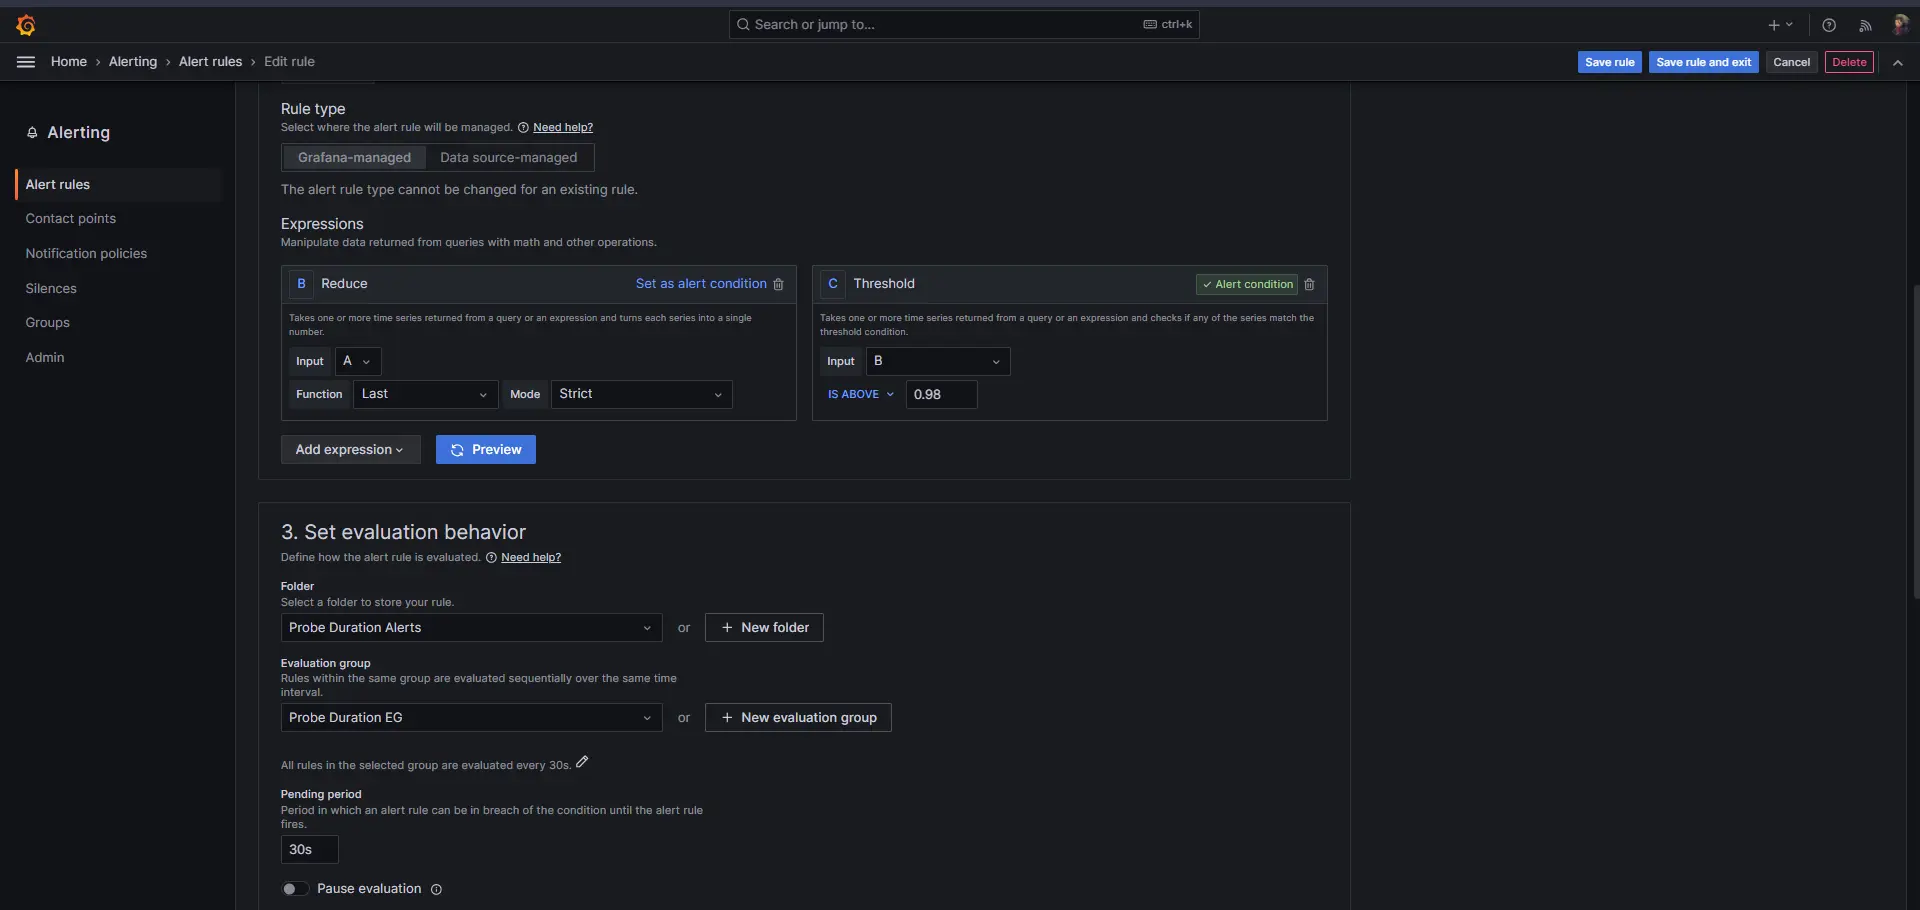
After entering the required information, click the “Create Rule” button to save the alert rule configuration.
Adding Contact Points
To add contact points in Grafana, defining the communication channels for alert notifications, follow these steps:
Begin by navigating to the Contact Points section in Grafana. Hover over the Grafana Cloud Alerting icon and click on “Alerts and rules.” Next, select “Contact points” from the left-hand menu. In the “Choose Alertmanager” dropdown menu, pick the Alertmanager instance to which you wish to add contact points. Click the “Add Contact Point” button to initiate the contact point creation process.
Provide essential details for the contact point:
- Assign a descriptive name to the contact point for easy identification.
- Select the integration type for the contact point, such as Email, Slack, or Webhook.
- Fill out mandatory fields based on the chosen integration type (e.g., email addresses for Email integration).
- Configure any optional settings available for the selected integration, if applicable.
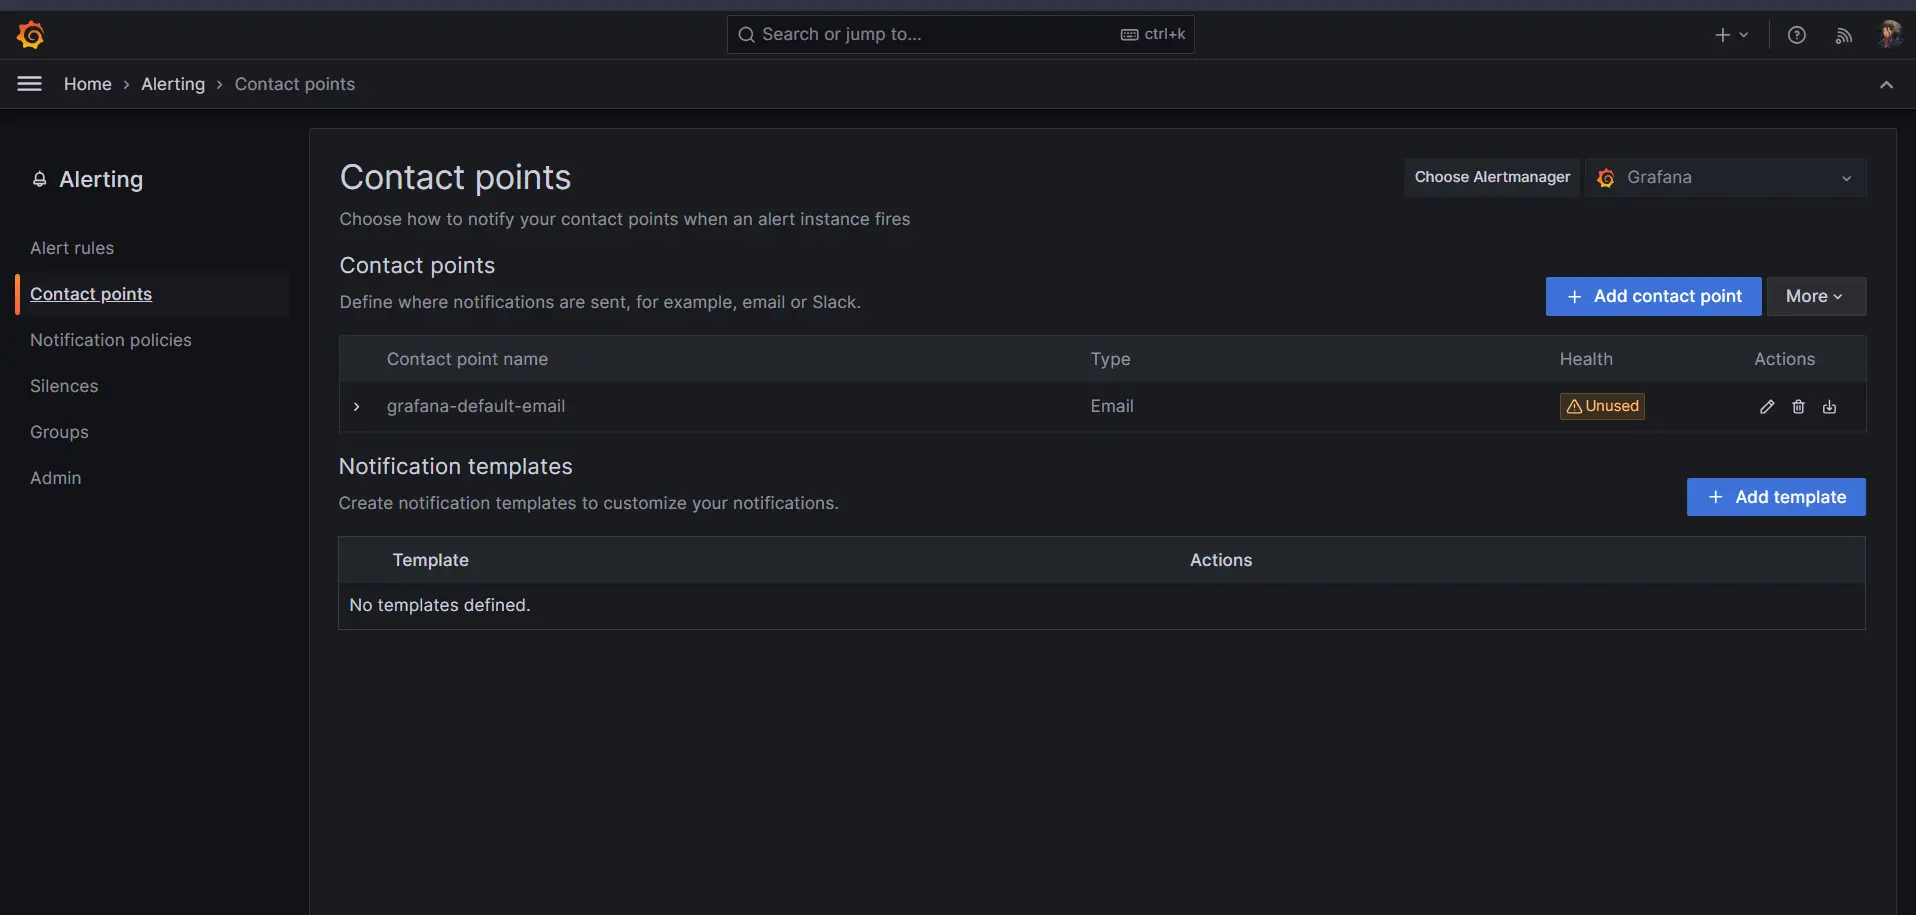
Optionally, if you want to suppress notifications when an alert resolves, check the “Disable resolved message” checkbox. For multiple channels or different integration types, you can add additional contact point types by clicking “New contact point type” and repeating the process for each. Finally, click the “Save Contact Point” button to complete the configuration and save the contact point.Condition: Define the condition that must be met for the alert rule to trigger. For example, you could set a condition like avg(cpu_usage) > 0.9 to trigger when the average CPU usage exceeds 90%.( I have used “avg(probe_duration_seconds{instance=”https://website.com”}) by (instance)” for the purpose of monitoring this website’s performance).Annotations: (Optional) Add annotations to provide additional context or explanations about the alert rule. Annotations can be helpful for documenting the purpose or actions to be taken when the alert triggers.Labels: (Optional) Assign labels to the alert rule for categorization and grouping purposes. Labels help organize and manage multiple alert rules effectively.
Exploring Further
Grafana offers a wealth of advanced features to enhance your monitoring capabilities. Explore templating to dynamically populate panels with specific data based on variables. Utilize annotations to highlight significant events or provide context for specific data points. Leverage alerting to receive notifications when predefined thresholds are breached, ensuring proactive monitoring.
Conclusion
In this blog post, we’ve walked through the configuration of Prometheus and Grafana to monitor a website using the Blackbox Exporter. The ability to visualize key metrics in Grafana provides a powerful tool for identifying performance bottlenecks and ensuring the reliability of our web services. Monitoring is an ongoing process, and this setup can be extended to include additional metrics and alerts based on specific thresholds. As we navigate the complex world of web applications, having a robust monitoring system in place becomes crucial for delivering a seamless user experience.
