Introduction
The highly anticipated Grafana 10.2 has arrived, packed with a range of compelling features and enhancements set to elevate your dashboard and data visualization experience. It’s important to note that some of these features are in their early development stages and may not be supported in Grafana Cloud as outlined in their official documentation. Given their experimental nature, these features are subject to change or removal without prior notice. Now, let’s explore the standout features in this latest release.
Interactive Visualizations
Grafana 10.2 brings a game-changing feature to your dashboards: the introduction of interactive buttons within custom visualizations in the Canvas panel. This exciting enhancement enables users to seamlessly trigger specific API endpoints directly from their dashboards, adding a layer of interactivity that transforms the user experience.
AI-Driven Panel Titles and Descriptions
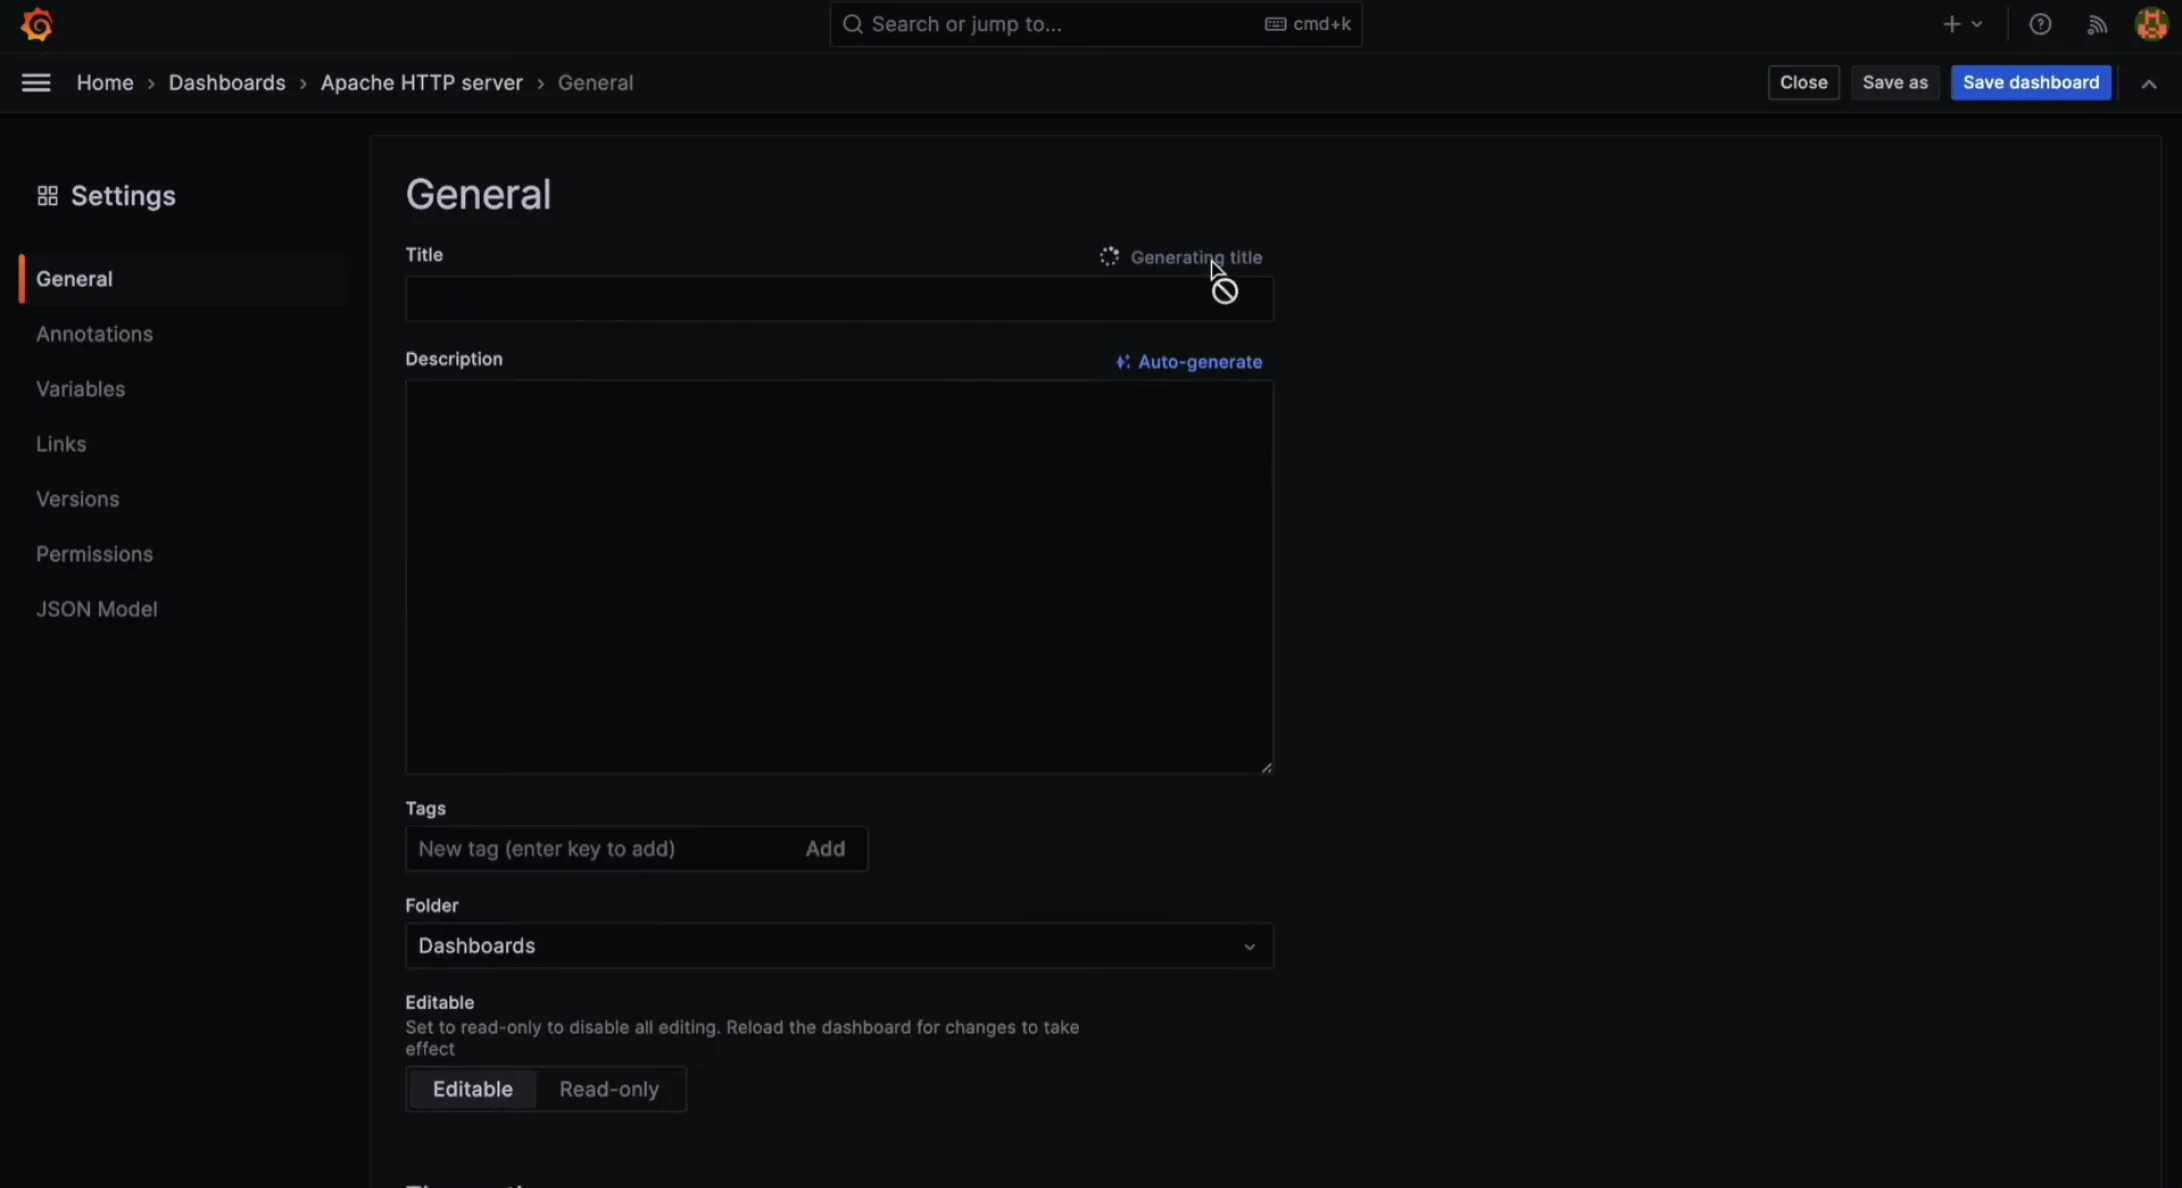
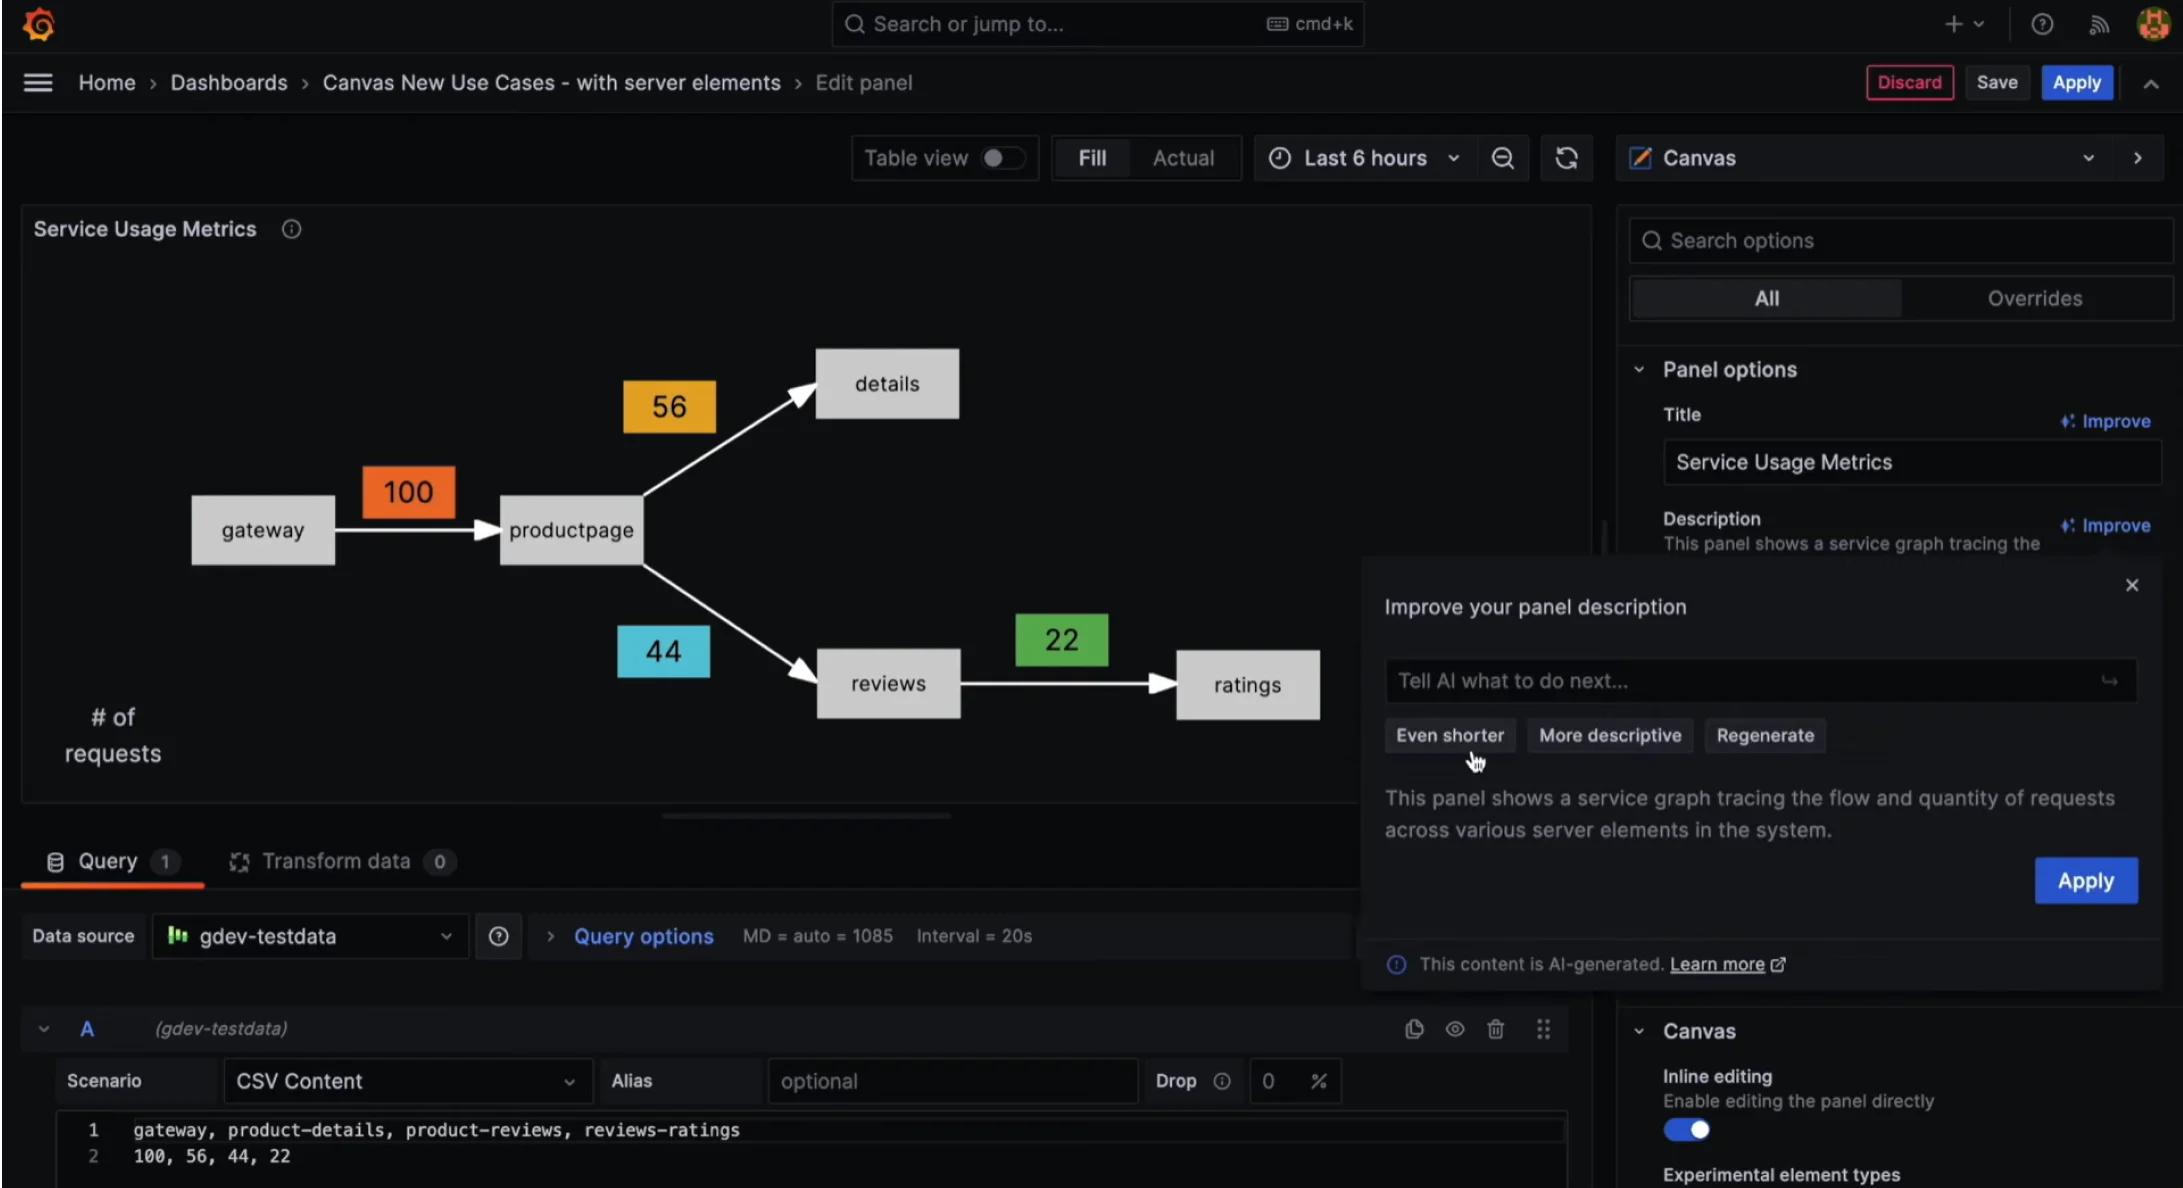
Grafana’s latest enhancement introduces AI capabilities that intelligently suggest fitting titles and descriptions as you input data into your dashboards. This feature not only streamlines your workflow, saving valuable time, but also contributes to maintaining a concise and well-documented history of your dashboard iterations.
To enable these AI capabilities, you must first enable the dashgpt feature toggle. Then install and configure Grafana’s LLM app plugin.Refer to the Grafana LLM app plugin documentation to know more . For Grafana Cloud users, please open a support ticket to enable this feature.
Public Dashboards for Streamlined Sharing
Empower your collaboration effortlessly with Grafana’s latest enhancement, public dashboards. Now available across all editions, this feature revolutionizes the way you share your insights.
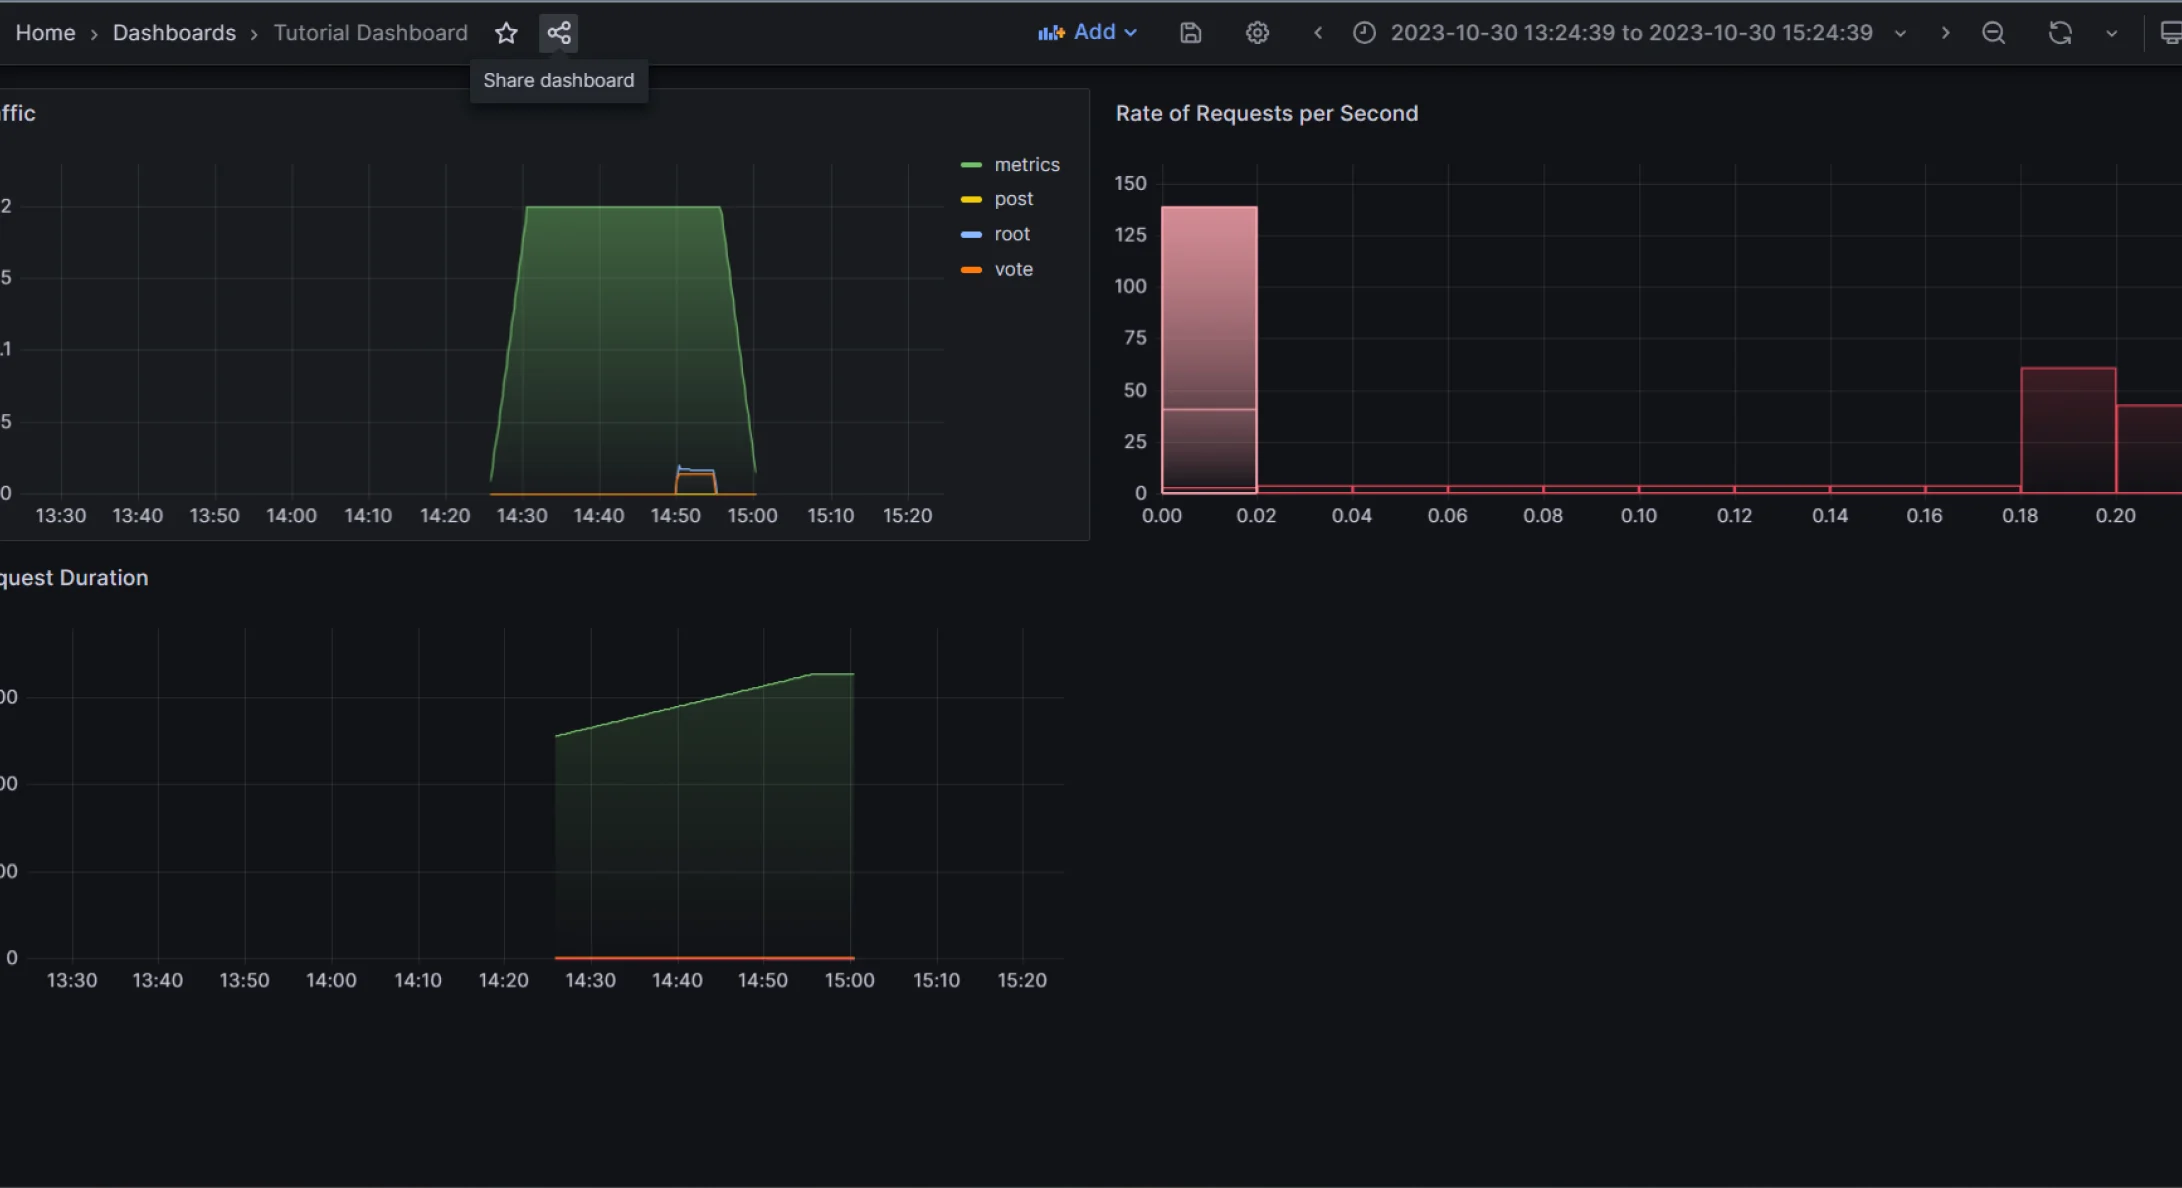
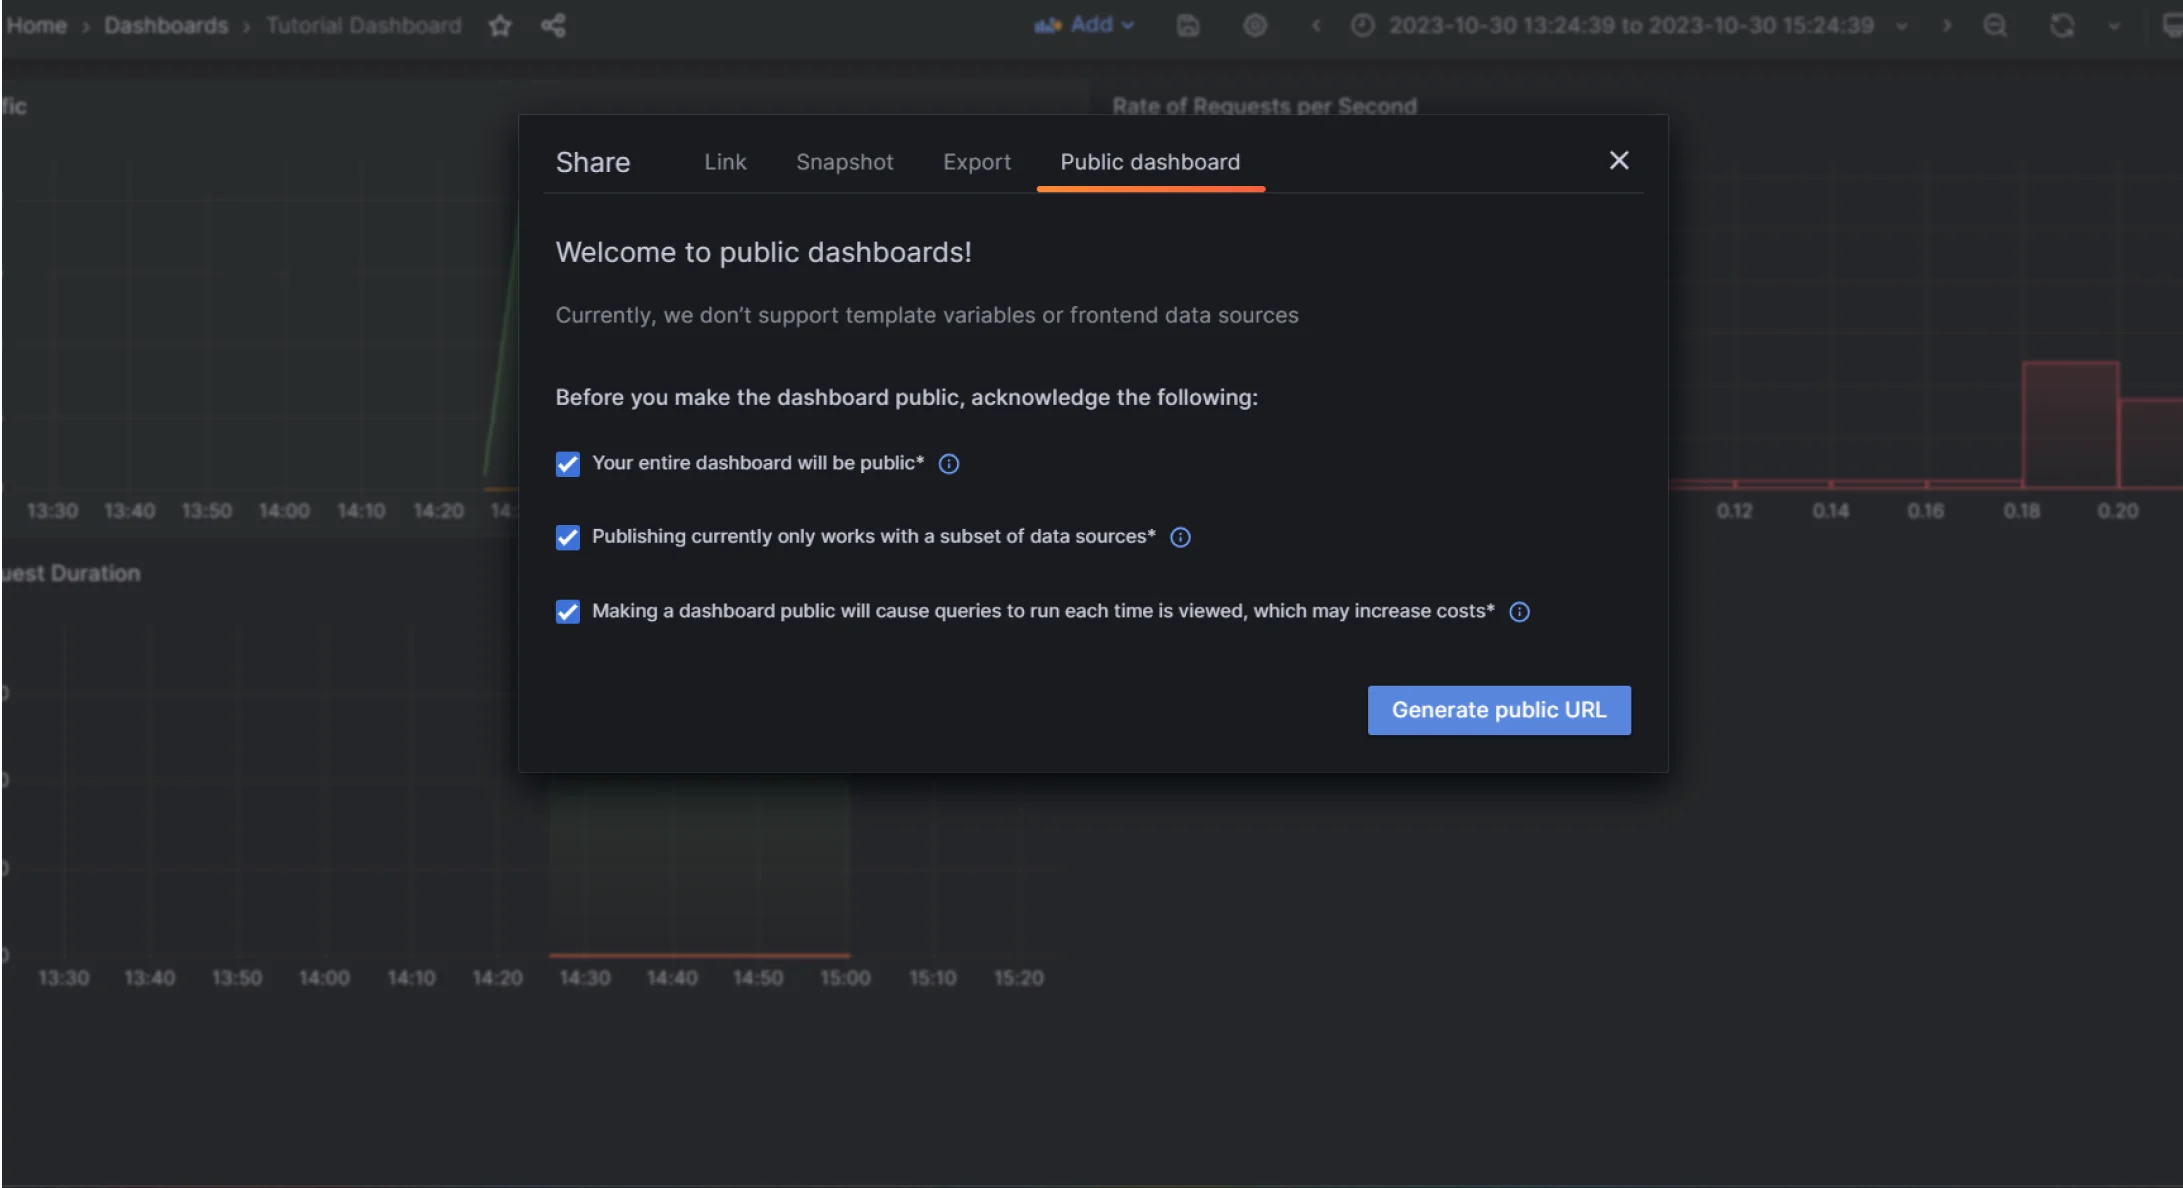
Creating a public dashboard URL enables seamless access for your colleagues and stakeholders without the need for logins. The added flexibility to pause, update, and resume sharing adds a strategic layer of control to your sharing process. Dive into this blog to uncover the simplicity and power of sharing your dashboards like never before.
Grafana OnCall Integration for Enhanced Alert Management
Embark on a new era of alert management with Grafana 10.2’s integration of Grafana Alerting and Grafana OnCall. This seamless integration transforms the way alerts are handled, introducing designated escalation chains and schedules for enhanced control. Uncover the power to effortlessly route alerts, detect trends, and recognize patterns, elevating your system monitoring to unprecedented levels. Now, you can also effortlessly export your alerting assets, including alert rules, contact points, and notification policies, as Terraform resources. Dive into the enhanced “Modify export” mode for alert rules, empowering you to seamlessly edit provisioned alert rules and export the modified versions. Excitingly, Microsoft Teams contact points are now supported when utilizing an external Alert manager.
Support for Grafana Cloud
Grafana Cloud is a hosted version of Grafana that makes it easy to get started with Grafana and to scale your Grafana deployments. With Grafana v10.2, you can now connect your Grafana instance to Grafana Cloud to take advantage of features such as automatic backups, monitoring, and alerting.
RED Metrics and Tempo Enhancements
Grafana Tempo is a new distributed tracing system from Grafana Labs. With Grafana v10.2, you can now use Grafana to visualize and analyze traces from Grafana Tempo. In the realm of Grafana Tempo, significant improvements have been made to the Tempo data source. Users can now display RED (rate, error, and duration) metrics directly from aggregated traces, offering valuable insights into system performance.
The addition of the “Aggregate By” option and enhancements to TraceQL streamline trace result navigation, facilitating efficient queries for multiple span sets per trace. The TraceQL query editor now has improved autocompletion, syntax highlighting, and error reporting. To leverage the calculation of RED metrics for the “spans” option, you’ll simply have to enable the metricsSummary experimental feature toggle.
Dashboard Variables in Transformations
Grafana 10.2 brings enhanced flexibility to panel creation by allowing the incorporation of dashboard variables directly into transformations. This feature enables the creation of more adaptable panels, allowing real-time updates based on variable adjustments. In a significant advancement, Grafana 10.2 expands the scope of dashboard variables in transformations.
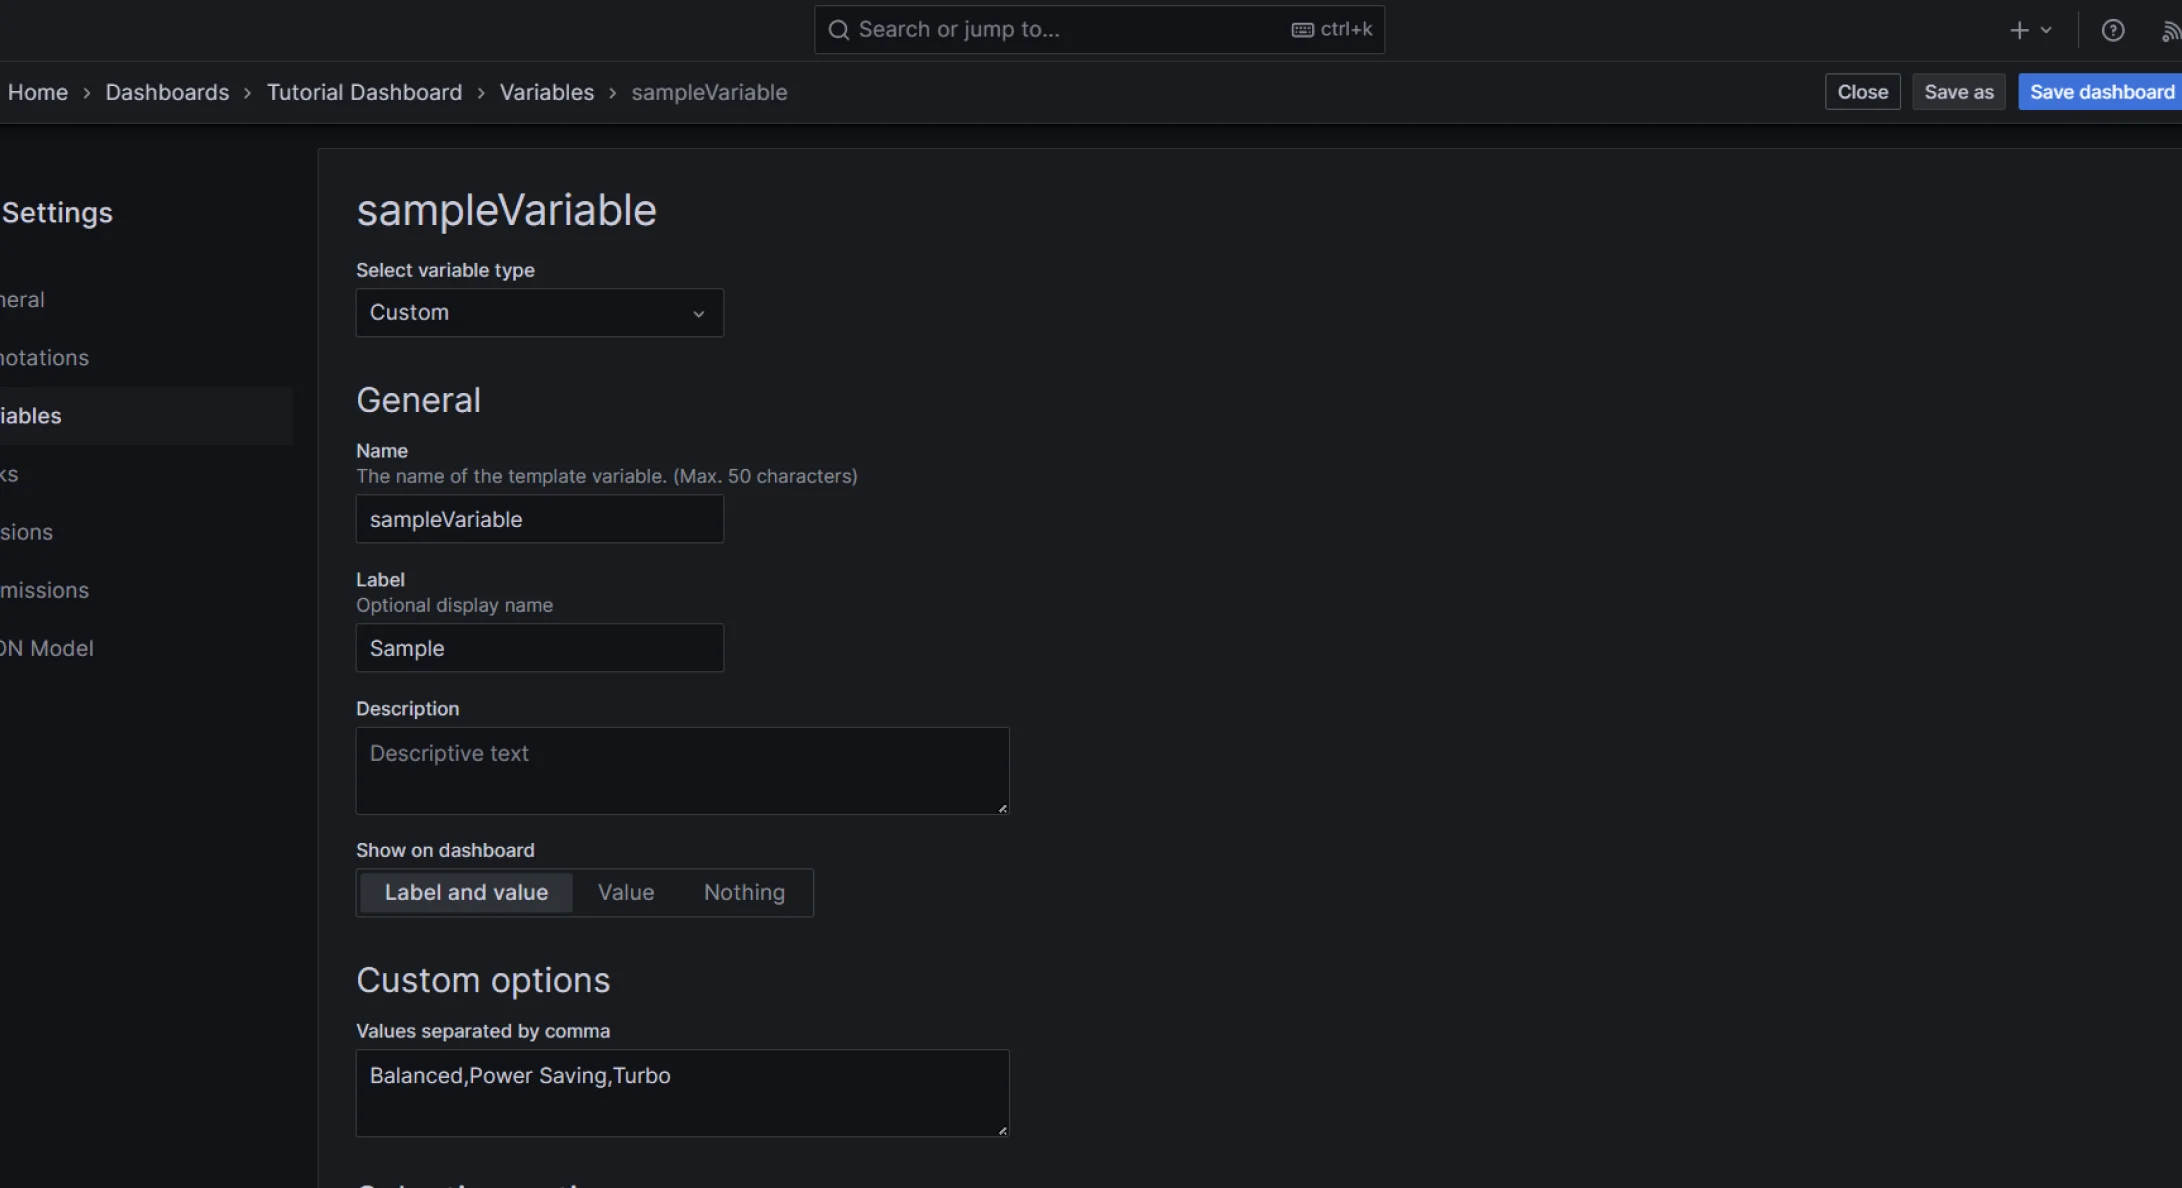
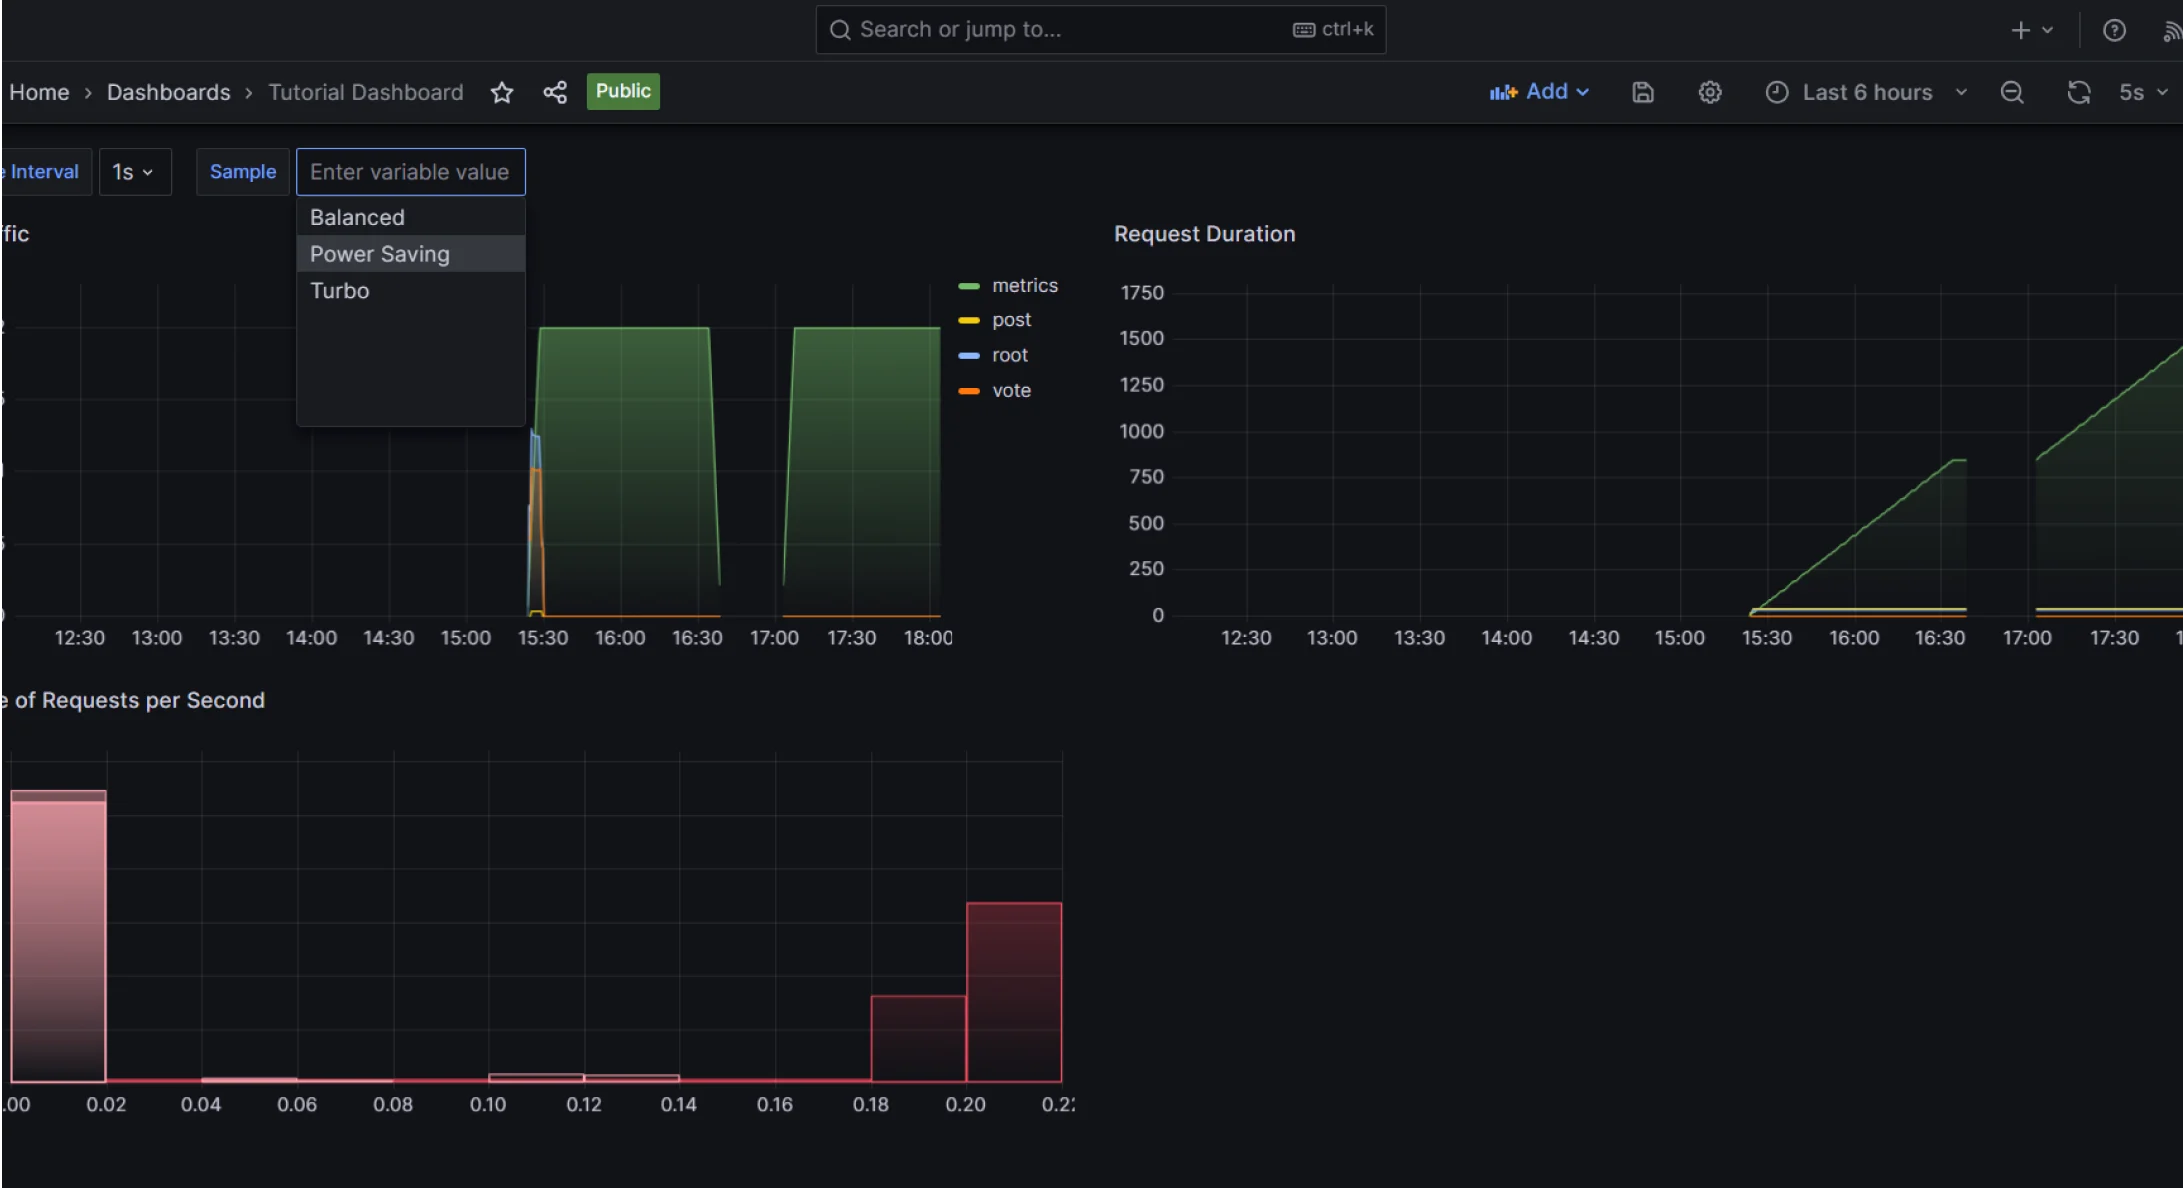
While previously limited to the Add field from the calculation transformation, variables are now supported across various transformations, including filter by value, create heatmap, histogram, sort by, limit, filter by name, and join by field. This broadened support enhances user convenience by simplifying the discovery of the right dashboard variable. Now, users can easily identify and implement variables through drop-down menus or suggestions, streamlining the transformation process for a more intuitive experience.
Improved Dashboard Browsing Experience
Effortlessly navigate and manage dashboards with the enhanced browse function. Folders, even with numerous dashboards, now offer expanded views for seamless scrolling and searching. Performance upgrades guarantee a consistent experience, whether you have 10 or 10,000 items. Notably, the “General” folder has been removed in this update due to its limited functionalities. Dashboards previously in “General” now appear alongside others in the default root view for better clarity.
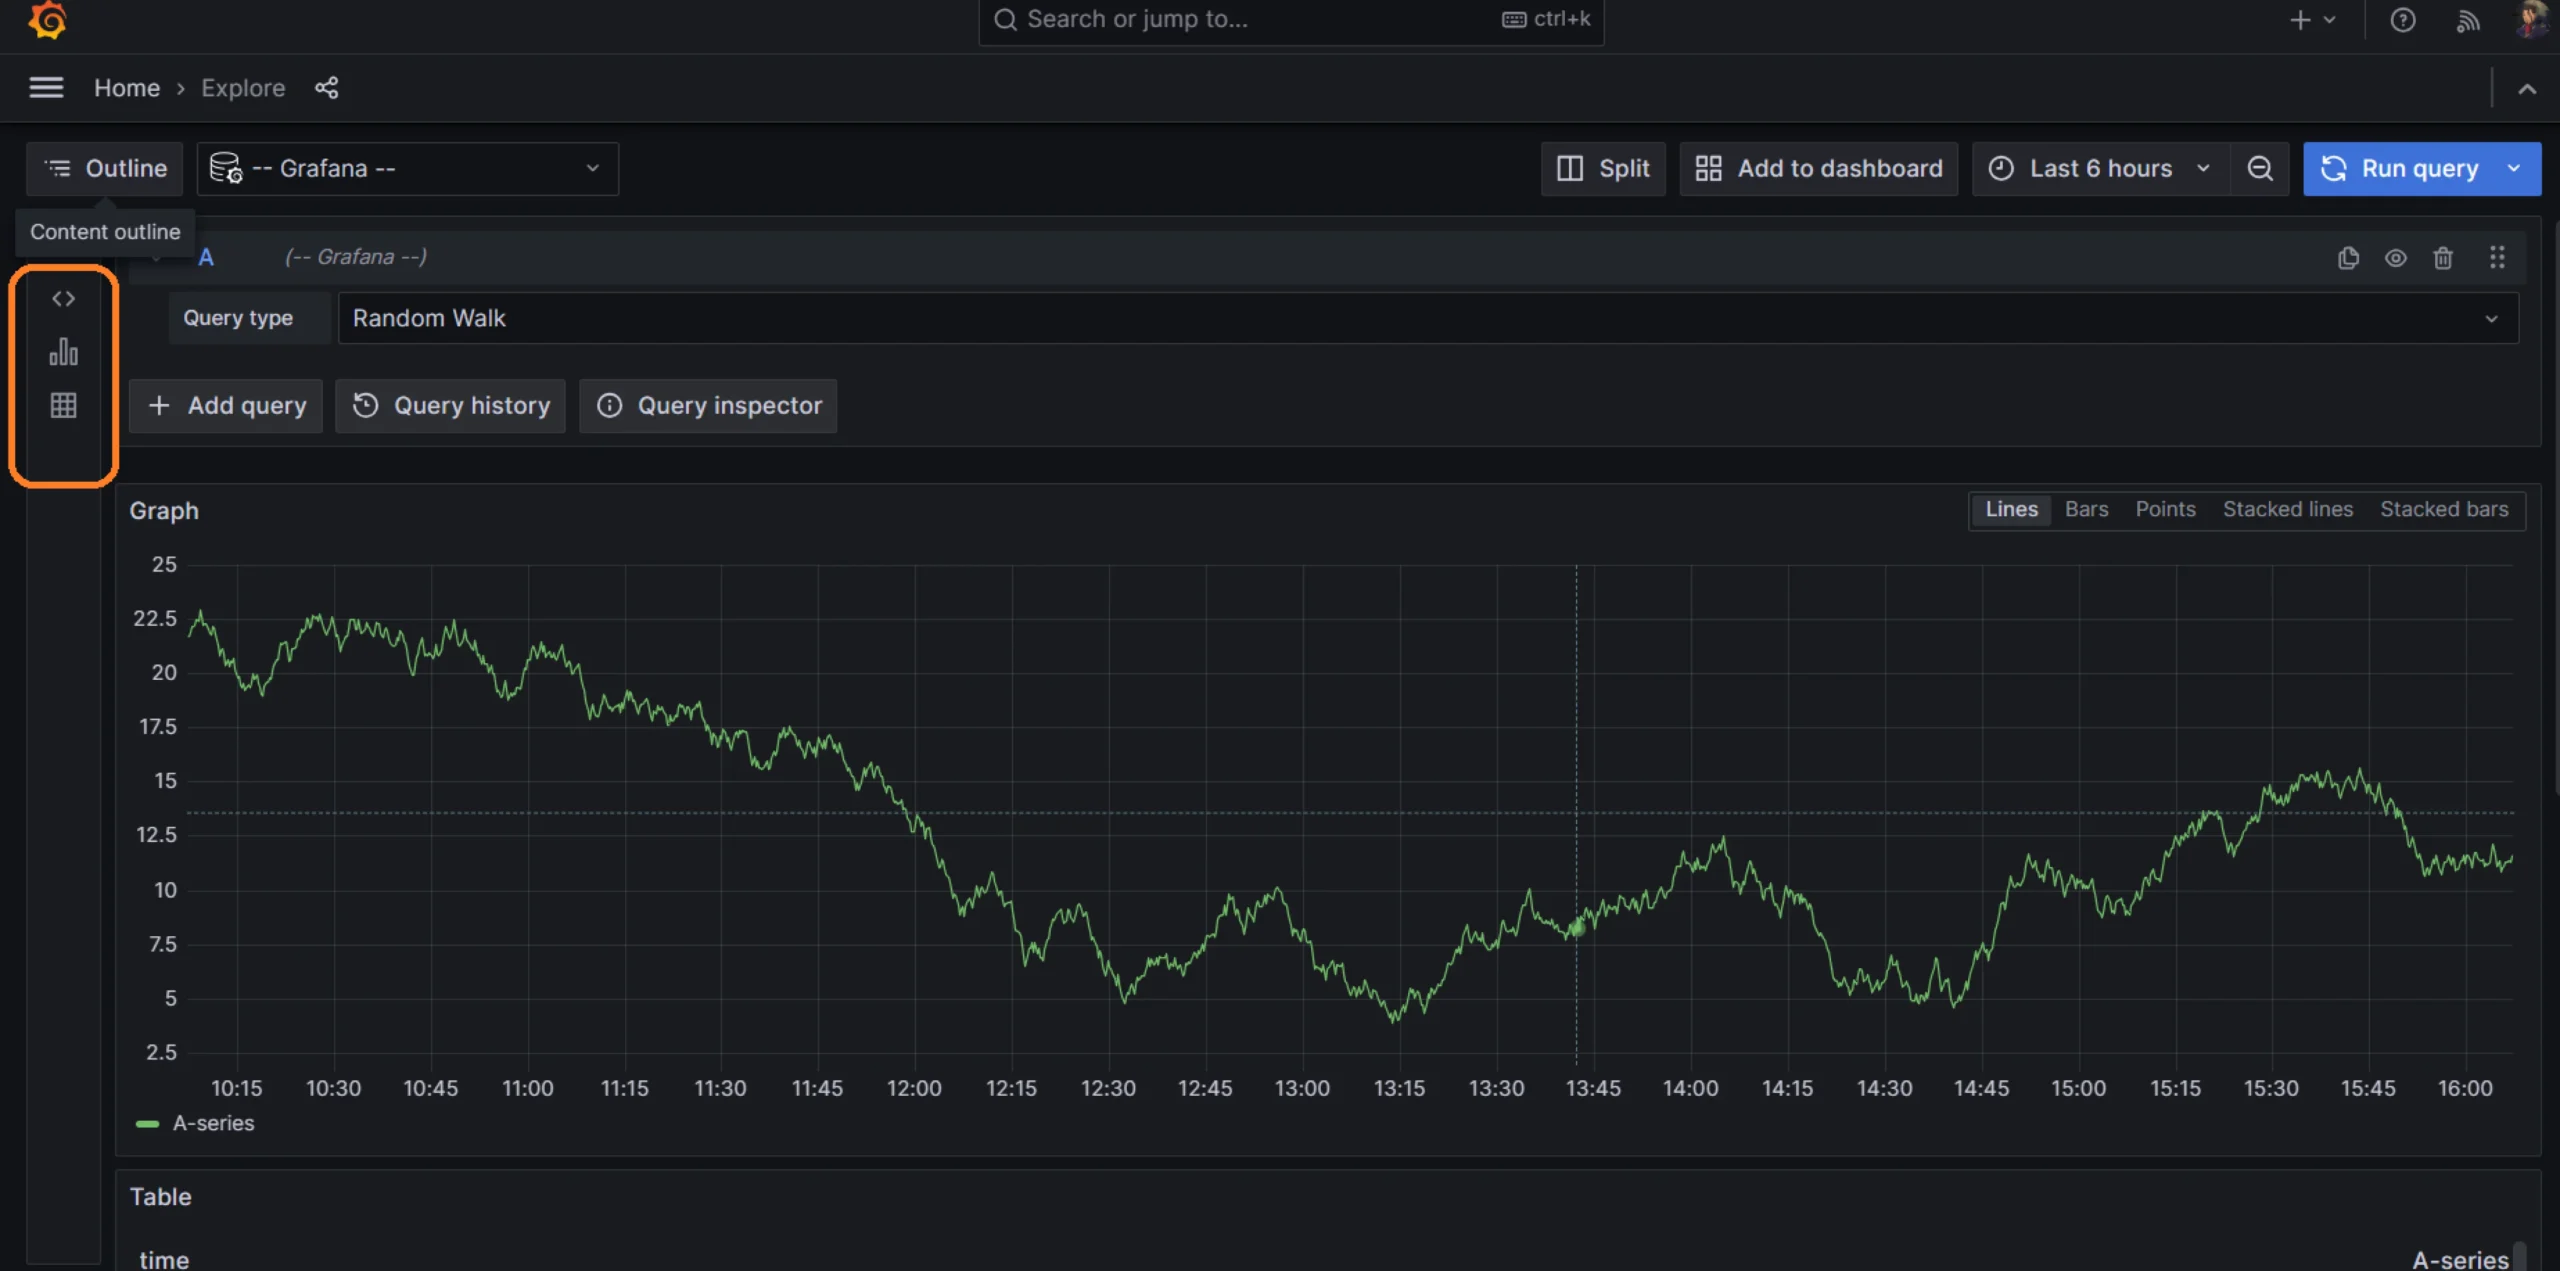
Streamlining Data Exploration: Grafana’s Content Outline Feature
In a bid to enhance data exploration, Grafana introduces Content Outline in Grafana Explore. This feature revolutionizes the search experience, allowing users to seamlessly navigate from log lines to traces and back. With a focus on preserving context, Content Outline ensures efficient and contextual investigations, making complex queries more manageable. Explore mixed data effortlessly, maintaining clarity, and gaining meaningful insights with Grafana’s latest addition.
AWS Data Source with Temporary Credentials
For users leveraging Grafana Cloud, the CloudWatch data source plugin now supports temporary credentials. This eliminates the need for manual key rotations, providing a more streamlined approach to maintaining AWS data sources.
No Basic Role for Better Access Control
Grafana administrators now have more control over access management with the introduction of the ‘No Basic Role.” This role comes with no predefined permissions, allowing administrators to set custom capabilities for specific service accounts or users.
Conclusion
Summing up, Grafana v10.2 is a game-changing release as it introduces features that take data visualization to new heights. With interactive buttons and AI-driven panel titles and descriptions, it is definitely a leap forward. Public dashboards simplify sharing, on-call integration enhances alert management, and Grafana Cloud brings awesome benefits. Tempo and RED metrics boost analytical capabilities, while the Content Outline feature streamlines data exploration. The ‘No Basic Role’ empowers administrators, and improved dashboard browsing enhances the user experience. Grafana 10.2 marks a milestone, refining the platform to be intuitive and powerful for data enthusiasts. Upgrade now to redefine your data journey. For more details on the release, check out their official documentation.
